Tag: Architecting Zero Downtime Infrastructure

  • Episode 19: ZFS Replication: Your First Step to Disaster Recovery

    Hello and welcome back! It’s great to have you here for episode nineteen of Architecting Zero Downtime Infrastructure.

    This week, we’re diving into a topic that I believe is the absolute cornerstone of any serious business continuity plan: ZFS Replication.

    So many organizations I talk to believe they’re safe because they have a nightly backup. And look, a backup is fantastic—it’s about data preservation. But a real disaster recovery plan is about service availability. The fundamental question we need to answer isn’t just, ‘Can I get my files back?’ It’s, ‘How quickly can I get my business running again?’

    This is where ZFS replication changes the game entirely. It moves us beyond simply protecting data and towards guaranteeing the availability of the critical services that depend on it. Let’s get into it.

    What is ZFS Replication, Really?

    It’s tempting to think of ZFS replication as just a fancy way to copy files, maybe like using a tool like rsync. But the process is fundamentally different, and in my experience, infinitely more robust.

    Let me paint a vivid picture for you. Using rsync is like sending a scout to another library with a list of books. The scout checks each book, one by one, to see if it’s changed, and then brings back the updated versions. It works, but there’s a lot of room for error and it can be slow if the library is huge.

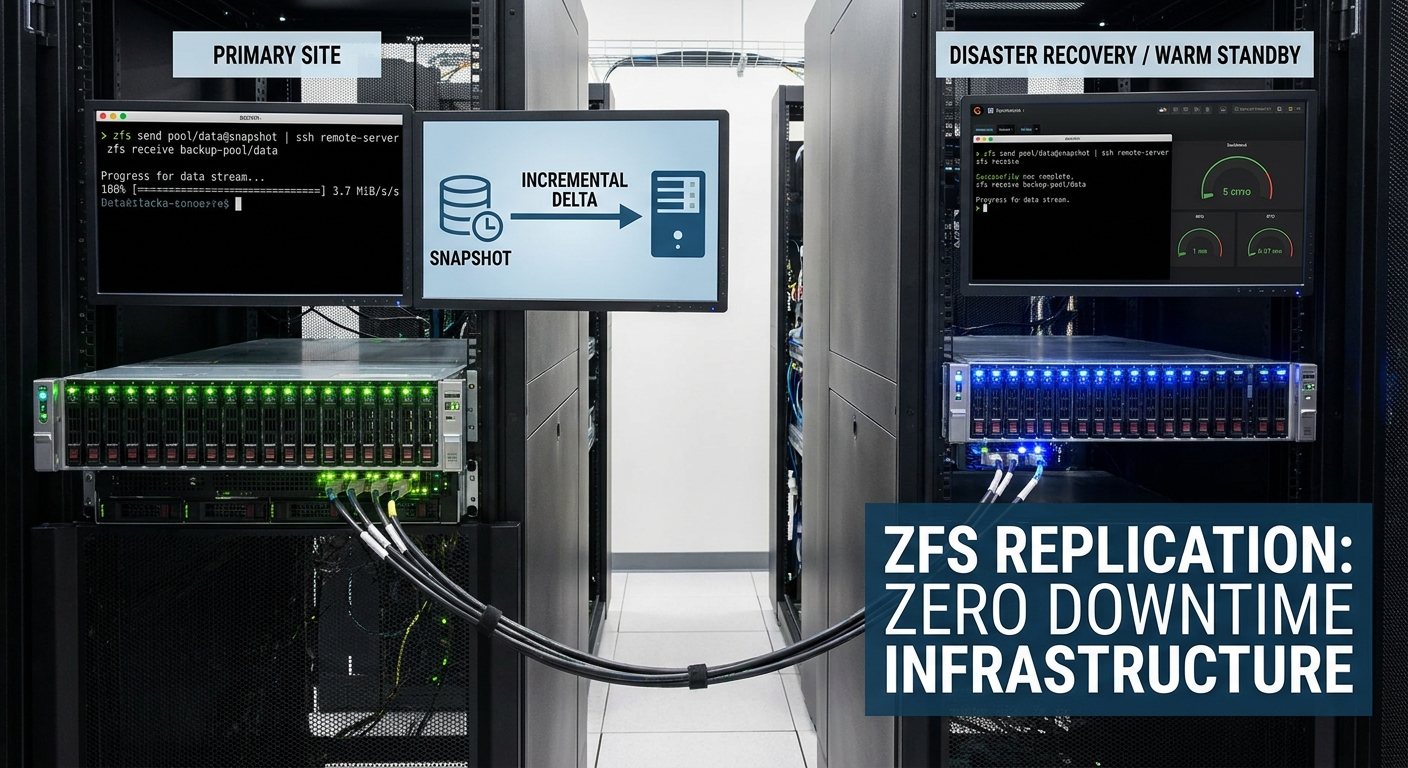
    ZFS replication, on the other hand, is like having a magical teleporter. It takes an instantaneous, read-only picture of your entire dataset—a snapshot—and serializes that entire picture into a single stream of data. We’re not copying files; we’re transmitting the exact state of the filesystem at a precise moment in time, block by block.

    The benefits here are profound:

    • Absolute Consistency: The operation is atomic. It’s an all-or-nothing deal. You will never get a half-finished, corrupt copy.
    • Blazing Efficiency: Since it works at the block level, it’s incredibly fast.
    • Guaranteed Integrity: ZFS has built-in checksums, so you have mathematical proof that the data that arrives is identical to the data that was sent.

    The Mechanics: zfs send and zfs receive

    At the heart of this entire process are two beautifully simple, yet incredibly powerful commands: zfs send and zfs receive. They are the dynamic duo of data resilience.

    1. zfs send: This command takes one of those snapshots we just talked about and converts it into that serialized stream. It’s a complete, self-contained representation of your dataset.
    2. zfs receive: This command listens for that stream on a destination server and perfectly reconstructs the dataset, block for block. It even brings over all the dataset’s properties, like compression settings or user quotas. It creates a perfect clone.

    So how do we connect them? My personal favorite method, and the standard practice, is to pipe the stream directly over a secure channel like SSH. The elegance of this design still impresses me.

    In practice, a command for a full replication looks something like this:

    Bash

    zfs send pool/data@snapshot-1 | ssh remote-server zfs receive backup-pool/data

    That single line encapsulates a secure, atomic, and verifiable transfer of your most critical data. How cool is that?

    The Magic of Incremental Replication

    Now, you might be thinking, “That’s great, but my initial transfer is several terabytes. That’s going to take forever!” And you’re right, it will. But this is where the real magic of ZFS reveals itself: incremental replication.

    Once that first full snapshot is safely on your remote server, you never have to send the whole thing again. Ever. For every subsequent transfer, you only send the difference—the delta between the snapshot you last sent and the new one you just created.

    This completely changes the economics of disaster recovery. Your transfers can shrink from terabytes down to megabytes or even kilobytes. Because these updates are so small and fast, you can run them with incredible frequency with almost no impact on your production systems.

    My personal rule of thumb for critical datasets is to replicate every fifteen minutes, or even every five. This is how we achieve a very low Recovery Point Objective (RPO). You’re no longer risking a full day of data loss; you’re risking just a few minutes. That is a fundamental shift in how you protect your business.

    Use Case 1: The Reliable Offsite Backup

    Let’s walk through the most common use case: creating a rock-solid offsite backup to protect against a site-level disaster like a fire, flood, or major power outage.

    For that initial, multi-terabyte transfer, sending it over the internet is often impractical. What I find works best is to ‘seed’ the remote server. We’ll do the first zfs send to a large, encrypted external hard drive. Then, we physically ship that drive to our disaster recovery site, plug it in, and use zfs receive to load the baseline data. The heavy lifting is done.

    From that point on, it’s all about simple automation. We set up a cron job or a systemd timer to run on a schedule. The script automatically:

    1. Creates a new snapshot on the primary server.
    2. Performs an incremental zfs send to the offsite server.

    Because it’s only sending the changes, the transfer is small, fast, and reliable. Your data is now safely and consistently mirrored somewhere else, ready for you when you need it most.

    Use Case 2: The Warm Standby Server

    An offsite backup is fantastic, but for truly critical services, we can elevate this concept to a full disaster recovery strategy. This is where we build a ‘warm standby’ server.

    The replication mechanism is exactly the same, but we drastically increase the frequency. Instead of nightly, we replicate every five minutes.

    Now, imagine your primary server completely fails. With a warm standby, the recovery process is beautifully straightforward. We simply log into the standby machine, ‘promote’ the replicated dataset to make it read-write, and repoint our applications to this secondary server.

    Just like that, you are back in business. We’ve moved beyond restoring files from a backup; we are restoring an entire service. This is how we dramatically reduce our Recovery Time Objective (RTO) from potentially hours or days down to mere minutes.

    Common Pitfalls and How to Avoid Them

    As powerful as this all is, it’s not infallible. I’ve seen a few common, and painfully avoidable, mistakes trip people up.

    • Snapshot Runaway: This is the big one. Every snapshot you create consumes space. Without an automated process to prune old ones, you will eventually fill up your storage pool. It’s not a matter of if, but when.
    • ZFS Version Mismatch: ZFS is incredibly backward compatible, but trying to send new features to an older ZFS version on the receiving end can cause failures. Keep your systems reasonably in sync.
    • Silent Failures: What happens if the network drops mid-transfer, or a script fails to run? A silent failure is the most dangerous failure of all. My unbreakable rule: a replication system without monitoring is a system you don’t actually have. You must have robust alerting that tells you when a replication cycle fails.

    Automation is Your Best Friend

    Given those pitfalls, you can see why running these commands by hand just isn’t a scalable or reliable strategy for a production system. What I always implement is a solid layer of automation.

    You could write your own shell scripts, but what I find works best is to use dedicated, well-supported management tools. There are some fantastic open-source options out there. I’ve had a great deal of success with tools like sanoid and its partner syncoid, and another excellent one is znapzend.

    These tools are built to manage the entire lifecycle for you. They handle:

    • Snapshot creation on a defined schedule.
    • The replication process itself (including resuming failed transfers!).
    • And critically, the automated pruning of old snapshots to keep your storage healthy.

    This makes the whole process robust, consistent, and truly hands-off.

    Tying It All Together

    So, what I hope you take away from our discussion today is that ZFS replication is far more than just another backup tool. You’ll find it’s one of the most powerful, efficient, and fundamentally consistent methods for achieving real business continuity.

    We’ve seen how it enables that essential offsite backup to protect you from disaster, and how you can use that same mechanism to build a warm standby server, bringing your recovery time down from hours to minutes.

    Once you have that level of confidence—knowing your data is safe and recoverable—the next logical question is, “How can I make it faster?”

    That’s a perfect lead-in to our next episode! I hope you’ll join me next time for episode twenty, ‘Performance Tuning ZFS: Recordsize, Compression, and You’, where we’ll dive into optimizing your pools for the specific workloads you run.

    Thanks for reading! As always, I’d love to hear your questions or experiences with ZFS replication in the comments below.

  • Episode 18: Snapshots vs. Backups: Securing Your Data

    Hello and welcome back to Architecting Zero Downtime Infrastructure!

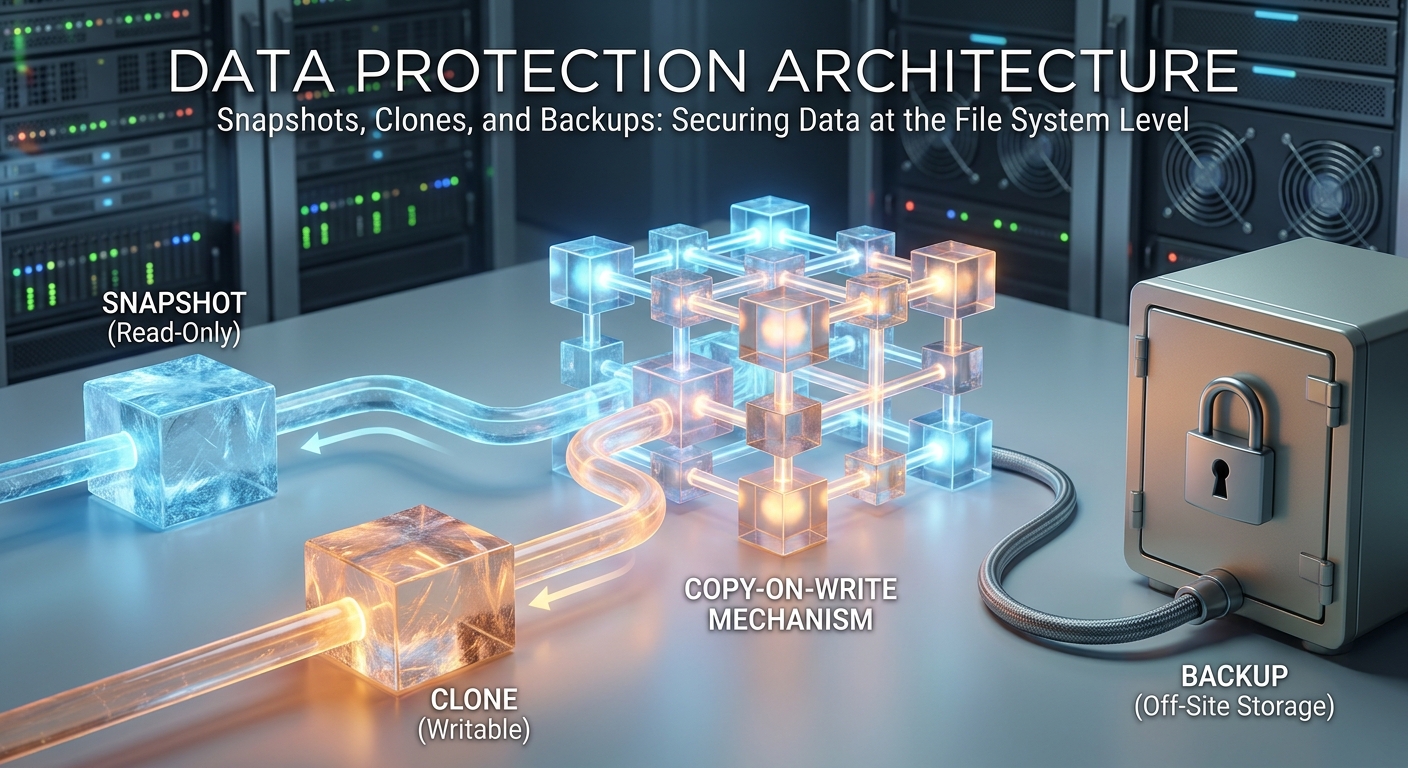
    This is episode eighteen, and today we’re tackling a topic that’s incredibly powerful but often misunderstood: Snapshots, Clones, and Backups.

    Now, we’ve spent a good deal of time on hardware resilience—protecting our data from the physical failure of a disk drive with technologies like RAID. And that’s fantastic! But what happens when the threat isn’t a dying disk? What about the far more common, gut-wrenching problems, like an administrator’s typo, a software update that goes sideways, or something more malicious, like ransomware?

    For these challenges, RAID is completely helpless. It will happily write your corrupted data across all its disks. We need a different class of tool, one that operates at a higher level. Today, we’re going to explore the powerful, instantaneous data protection capabilities built right into the very file systems we use every day.

    What Exactly is a Snapshot?

    Let’s start with the core concept. The simplest way I find to think about a snapshot is as a perfect photograph of your data. Imagine your entire file system, with all its files and folders, frozen in time. When you take a snapshot, you are capturing a perfect, read-only view of what that system looked like at that precise second.

    But here’s the critical detail, and the part that makes this technology so magical. A snapshot is not a full copy of your data. If you have a terabyte of data, taking a snapshot doesn’t suddenly consume another terabyte of disk space. In fact, when you first create it, it uses almost no space at all.

    This is because a snapshot is essentially just a list of pointers… a map that points to the original data blocks on your disks. It’s an instantaneous reference, not a time-consuming duplicate.

    The Magic Behind the Curtain: Copy-on-Write (CoW)

    So, you might be asking, “How is this even possible?” How can we get an instant, space-efficient copy of potentially terabytes of data? The mechanism is really quite elegant, and it’s a concept called Copy-on-Write, or CoW for short.

    Think about a more traditional file system. When you edit a file and hit save, the system often overwrites the original data blocks on the disk with your new information. The old version is just… gone. Poof.

    A Copy-on-Write file system, like ZFS or Btrfs, takes a beautifully robust approach: it never overwrites live data. When you modify a file, the file system writes the new data to a completely new, unused block. Then, it just updates its internal map to point to that new location.

    And that’s the key! The snapshot we took? Its map is still pointing to the original, untouched data blocks. They were never overwritten… they were simply left alone, perfectly preserved. That’s why it’s so fast. There’s no heavy lifting, no mass data copy. We’re just creating a new set of pointers.

    The Ultimate ‘Undo’ Button for Your Server

    Now that we understand the mechanics, let’s talk about where this becomes incredibly valuable in the real world. I’ve always thought of snapshots as the ultimate ‘undo’ button for a server.

    Take a common, high-stakes scenario: a major operating system patch or a complex software deployment. There’s always that little knot of anxiety in your stomach. My unbreakable rule is to take a snapshot just moments before the process begins.

    If the upgrade goes smoothly, wonderful! We simply delete the snapshot and move on. But if something goes horribly wrong—if the system becomes unstable or applications start crashing—we don’t start a painful, hours-long restore from tape. We simply roll back. The entire system reverts to its pre-upgrade state in seconds. It’s a complete game-changer.

    Or consider a more modern threat: ransomware. Because snapshots are inherently read-only, the ransomware can’t touch the data they contain. This means you can roll the system back to the state it was in minutes before the attack. It turns a catastrophic, potentially business-ending event into a manageable incident.

    From Snapshots to Clones: The Writable Sibling

    The read-only nature of snapshots is their greatest strength for protection, but sometimes you need a copy of an environment that you can actually work with. This is where the next logical step in this technology comes in: the clone.

    The easiest way to think about it is that a clone is simply a writable version of a snapshot.

    There’s a very clear parent-child relationship:

    1. First, you create your read-only snapshot (the parent).
    2. Then, from that snapshot, you instantly create a clone (the child).

    Just like its parent, the clone is created in a fraction of a second and initially consumes almost no new disk space. It’s still just pointing back to all the original data blocks held by the snapshot. The moment you start writing to the clone, however, the copy-on-write process begins again, and only your changes—the delta—begin to consume new storage.

    This incredible efficiency is where clones really begin to change how you operate. For me, one of the most powerful applications is in development and testing. My process is to create a ‘golden image’ of an application or database, get it set up perfectly, and then take a snapshot. From that single snapshot, I can instantly provision dozens of fully writable clones, one for each developer. No more waiting hours for multi-terabyte databases to copy. It is proliferation… without the penalty.

    My Most Important Rule: Snapshots Are NOT Backups

    It’s easy to get excited by the power of these tools, but I need to pause here for what is the most critical distinction we will make today. I want to be absolutely clear:

    Snapshots are not backups.

    Say it with me. Snapshots are not backups. They are brilliant for rapid, operational recovery, but they share a fundamental, fatal weakness with your live data. Your dataset, your snapshots, your clones… they all live on the same physical storage system. If that system fails—if the entire array goes offline due to a hardware fault or a site-wide power outage—you will lose everything. The production data, and every snapshot along with it.

    This is why a robust architecture always incorporates what we call the 3-2-1 rule: three copies of your data, on two different media types, with one of those copies located securely off-site. Snapshots are an essential part of a modern strategy, but they are not, and never can be, a substitute for a true backup.

    Engineering a Perfect Backup Strategy

    So, if a snapshot isn’t the backup itself, what is its proper role? The answer is that a snapshot becomes the perfect source for the backup.

    Think about the challenge of backing up a live, busy server. Files are changing, databases are in flight. It’s a moving target, and you risk capturing an inconsistent, even corrupt, state.

    The workflow I’ve found to be most reliable is a simple, three-step process:

    1. Quiesce: Briefly pause writes to the application (for a database, this is often called a ‘hot backup’ mode).
    2. Snapshot: Take an atomic snapshot. This is instantaneous. The moment it’s created, the live application can resume full operation.
    3. Backup: Run your backup job against the read-only snapshot. Your backup system can now take its time, reading from a perfectly frozen, consistent point in time, while your production system carries on completely unaffected.

    This is how we move from hoping for a good backup to engineering one.

    Where To Find These Superpowers

    This technology is more common than many people realize. In my own work, the system I consistently rely on is ZFS. It was built for this from the ground up, and its zfs snapshot and zfs clone commands are a model of clarity. But this isn’t a ZFS-only feature:

    • In the Linux world, Btrfs offers similar capabilities.
    • If you use a Mac or an iPhone, Apple’s APFS file system uses this technology extensively under the hood.
    • In the high-end enterprise world, this has been a cornerstone for decades in dedicated storage systems from vendors like NetApp.

    The point is, this is not some exotic, experimental feature. It is a proven, foundational component of modern data management.

    Tying It All Together

    What we’ve established today are three foundational principles for modern data protection at the file system level:

    • Snapshots: Our instant, read-only points in time that act as a server’s undo button.
    • Clones: Our space-efficient, writable copies that let us provision entire environments in seconds.
    • The Golden Rule: Neither of these tools replaces a true, off-site backup. They are powerful components of a strategy, not the strategy itself.

    This, of course, leads to the next logical question. We’ve mastered creating these powerful, consistent snapshots on our primary machine. But how do we get them to another system to protect ourselves from a complete site failure?

    That is precisely what we’ll cover next time. Join me for Episode 19, where we’ll dive into ‘ZFS Replication: Your First Step Towards Disaster Recovery’.

    Thanks for reading, and I’d love to hear your thoughts or questions in the comments below! Talk to you next time.

  • Episode 17: ZFS: Your Data’s Unbreakable Guardian

    Episode 17: ZFS: Your Data’s Unbreakable Guardian

    Hello and welcome back to Architecting Zero Downtime Infrastructure!

    It’s great to have you here. In our quest to build truly resilient systems, we spend an incredible amount of time architecting our application layers, optimizing our networks, and fine-tuning our compute clusters. We design for failure at every level. But what if I told you that all that elegant work rests on a foundation that, for most systems, is surprisingly fragile? I’m talking about the data on disk—the single source of truth for everything we do.

    You can have the most sophisticated microservices architecture in the world, but if your filesystem isn’t fundamentally sound, it’s all built on sand. This is why today, we’re going deep on a technology I believe is absolutely critical for our field: ZFS. It’s so much more than just a filesystem; it’s a combined volume manager and a powerful statement on how data should be protected in the modern era.

    To help us navigate this, I recently had the honor of speaking with one of the best guides imaginable, Dr. Evelyn Reed, a core developer on the OpenZFS project. Our conversation was so insightful that I wanted to distill the biggest takeaways for you here. We’re going to cover what makes ZFS a complete rethinking of data management, why it’s your best defense against silent data corruption, and how you can deploy it successfully.

    The “Aha!” Moment: Beyond Buckets of Storage

    Many of us have a moment where a piece of technology fundamentally shifts our perspective. For Dr. Reed, and for me personally, that moment with ZFS came from understanding its two core principles: pooled storage and copy-on-write.

    For those of us who grew up wrangling LVMs, hardware RAID controllers, and partitions, the first big shift is the storage pool, or ‘zpool’. Let me paint a vivid picture. Traditional storage management is like having a dozen different-sized buckets. You have to decide upfront how much water (data) goes in each, and if one gets full, it’s a pain to resize. ZFS throws out that entire model. Instead, you just give all your disks to the zpool, and it presents you with one giant, deep reservoir of storage. You can then carve out filesystems from this pool as needed, and they all share the total capacity and performance. It removes several layers of legacy abstraction and just simplifies everything.

    But the true game-changer, the design choice that enables all the magic, is its copy-on-write architecture. As Dr. Reed explained, ZFS never overwrites data in place. When you modify a block of data, ZFS writes the new data to a completely new location on disk. Only after that new block is safely written does it swing the metadata pointers to recognize the new version. This might sound like a minor technical detail, but it’s the heart of ZFS. It means every write operation is atomic—it either fully completes or it doesn’t. There is no in-between state. Your filesystem is always consistent. This is the bedrock upon which everything else—data integrity, snapshots, clones—is built.

    Your Data’s Personal Bodyguard: Self-Healing Integrity

    That copy-on-write model enables what I consider ZFS’s most critical feature: verifiable data integrity. We’re talking about active, relentless protection from silent data corruption, or ‘bit rot,’ a terrifying threat that most other filesystems are completely blind to.

    Here’s how it works. When ZFS writes a block of data, it also calculates a checksum for that block. But it doesn’t store the checksum right next to the data. Instead, it stores it way up in the metadata tree, pointing down to the data block. Think of it like a parent holding the unique fingerprint of their child. When you later ask to read that data, ZFS doesn’t just blindly trust the disk. It reads the data block and its parent block containing the checksum. It then re-calculates the checksum from the data it just read and compares it to the original, trusted checksum. If they don’t match, ZFS knows, without a doubt, that the data on disk has been corrupted.

    And this is where the magic happens. Let’s say you have a simple mirrored zpool (two disks holding identical copies of data). A read request comes in for a block on disk one. ZFS detects a checksum mismatch.

    1. It immediately discards the bad data. It simply refuses to return corrupted data to your application. Ever.
    2. It retrieves the correct, verified copy from the second disk in the mirror.
    3. It serves that correct data to the waiting application, which never even knew there was a problem.
    4. Crucially, in the background, it rewrites the correct data back to the first disk, automatically repairing the corruption.

    This isn’t a recovery tool you have to run on the weekend. It’s a constant, vigilant, self-healing process. The system is fundamentally designed to protect your data’s integrity, and it fixes problems the moment they’re found.

    More Than Just Safe: The Genius Caching System

    Okay, so ZFS is incredibly safe. But what about performance? This is where its intelligence really shines through a multi-layered caching system. Dr. Reed broke it down beautifully:

    • ARC (Adaptive Replacement Cache): This is the first and most important layer, living in your system’s RAM. ZFS will use as much free RAM as you let it to keep the most frequently and recently used data (your “hot data”) ready for near-instant access. It’s incredibly smart and effective.
    • L2ARC (Level 2 ARC): For read-heavy workloads with huge datasets that won’t fit in RAM, you can add a fast SSD to serve as a massive second-level read cache. This isn’t for storage; it’s a pure performance boost. It’s an incredibly cost-effective way to get flash-level read performance for a spinning-disk-sized budget.
    • SLOG (Separate Log Device): This one is for write performance, specifically for synchronous writes—the kind databases and NFS servers demand. These writes require an acknowledgment that the data is safely on non-volatile storage. A SLOG is a dedicated, fast device (like a low-latency NVMe SSD) that acts as a super-fast intake buffer. The write is committed to the SLOG almost instantly, the acknowledgment is sent, and ZFS then lazily flushes it to the main pool in the background. It’s the key to making write-sensitive applications fly.

    This intelligent hierarchy—RAM, then flash, then the main spinning pool—is how you build systems that are both exceptionally fast and incredibly safe.

    Debunking the Myths: Design Considerations, Not Limitations

    When architects evaluate ZFS, a few common myths always seem to surface. Dr. Reed offered some fantastic clarity on these:

    1. “ZFS needs a ton of RAM!” The reality is, ZFS uses a ton of RAM if it’s available… for caching! It’s a performance feature, not a strict requirement. More RAM means better read performance, but ZFS will run just fine on a modest amount. Don’t let this myth scare you off.
    2. “You can’t expand a RAID-Z vdev.” This one is true. You cannot add a single disk to an existing RAID-Z (ZFS’s version of RAID 5/6) group. My personal rule of thumb is to plan for this from the start. The correct way to expand a pool is by adding a new vdev (another group of disks). Knowing this helps you design your initial purchase and future expansion path correctly.
    3. “Which is better, mirrors or RAID-Z?” It depends entirely on your workload. For high IOPS workloads like virtual machines or active databases, mirrored vdevs will almost always give you superior performance. For storing large, sequential files like media archives or backups where capacity efficiency is key, RAID-Z is the perfect choice.

    These aren’t limitations; they’re simply design considerations you need to understand to build the right system for your needs.

    Dr. Reed’s Three Unbreakable Rules for a Successful Deployment

    So, you’re ready to design a system with ZFS. Where do you start? I asked Dr. Reed for her most critical advice, and it comes down to three principles.

    First, thoroughly understand your application’s I/O profile. Is the workload random or sequential? Read-heavy or write-heavy? This one analysis will dictate your entire pool layout, from choosing mirrors vs. RAID-Z to deciding if you need a SLOG.

    Second—and this is my unbreakable rule for any system I build with ZFS—always use ECC RAM. ZFS is built from the ground up to protect your data from corruption on disk. But it has to trust the data it holds in memory. Standard, non-ECC RAM is the one place where corruption can silently enter the system and be written to disk. Don’t compromise here.

    Finally, build a lab and practice failure. Before you ever put a ZFS system into production, create a small test environment. Pull a disk while it’s running. Simulate a power loss. Practice your recovery procedures until they are second nature. Confidence is built through practice, not just theory.

    The Journey Continues

    This discussion with Dr. Reed solidified my belief that ZFS forces us to demand a higher standard from our storage. Its foundation of unparalleled data integrity, its intelligent performance through multi-layered caching, and its administrative simplicity are a powerful combination for anyone serious about building zero-downtime infrastructure.

    And we’re just getting started. Next week, we’re going to build directly on this conversation. Our topic will be ‘Snapshots, Clones, and Backups: Securing Data at the File System Level’. You’ll see how that core concept Dr. Reed explained—copy-on-write—is precisely what makes these powerful, near-instant data protection tools possible. It’s the next logical step in our journey.

    Thank you for joining me today. I’d love to hear your thoughts or questions about ZFS in the comments below!

  • Episode 16: ZFS Caching Demystified: ARC, L2ARC, and SLOG

    Episode 16: ZFS Caching Demystified: ARC, L2ARC, and SLOG

    Hello and welcome back to Architecting Zero Downtime Infrastructure! I’m so glad you could join me for episode sixteen.

    Today, we’re going to pull back the curtain on one of the biggest secrets to ZFS’s incredible performance. When people talk about ZFS, they often—and rightly so—focus on its world-class data integrity features. But its performance is equally brilliant, and that magic is delivered by an elegant, multi-layered caching system.

    You’ve probably heard the terms thrown around: ARC, L2ARC, and SLOG. Let’s be honest, they can seem a bit cryptic at first. What I’ve found, time and time again, is that once you understand the distinct, vital role each one plays, tuning a ZFS system becomes a much more intuitive and rewarding process.

    So, that’s our mission today. We’re going to break them down, one by one, in plain English. My goal is simple: to give you the confidence to configure these components correctly for your specific workload, unlocking the maximum performance and reliability your hardware has to offer. Alright, let’s dive in!

    The ARC: Your Lightning-Fast RAM Cache

    Let’s start with the heart of the system: the ARC, which stands for Adaptive Replacement Cache. This is your primary, first-level cache, and it lives entirely in your system’s RAM. To put it simply, this is the fastest part of the entire ZFS storage hierarchy. By far.

    The key word here, and the source of its genius, is “adaptive”. Most traditional caching systems use a simple “Least Recently Used” (LRU) algorithm. The problem with LRU is that it’s… well, a bit naive. A single, massive read operation—like a weekly backup job kicking off—can completely pollute the cache, pushing out all the small, valuable bits of data your applications actually need from moment to moment. It’s a painfully common performance killer.

    ZFS is much, much smarter. The ARC maintains a dynamic balance between data that was Most Recently Used (MRU) and data that is Most Frequently Used (MFU). This means it’s intelligent enough to distinguish between a one-time, multi-terabyte file read and a critical 8KB database block that gets hammered a thousand times a minute. It adapts to your workload in real-time.

    And remember, it caches more than just read data! It also holds what we call “dirty” write data that’s patiently waiting its turn to be flushed down to your main storage pool.

    So, how does it make these decisions? Under the hood, the ARC manages four lists. You have your active caches for MRU and MFU data, but the really clever part is that each of those has a corresponding “ghost list”. Think of a ghost list as a memory of data blocks that were recently evicted from the cache. If a program requests a block that’s currently on a ghost list, the ARC gets a tap on the shoulder. It learns, “Aha! I kicked that data out too soon!” and it adjusts its strategy to favor that type of data more in the future. It’s a self-tuning, self-correcting system.

    My process for tuning the ARC:

    The main lever you have is the zfs_arc_max parameter, which sets its upper memory limit. On a dedicated storage server, my rule is simple: I let ZFS have almost all the RAM. But if that server is also running virtual machines, containers, or a database, you absolutely must cap the ARC to leave enough memory for those applications to breathe. A common and safe practice is to reserve a few gigabytes for the OS and other critical services, and then give the rest to the ARC. You can easily verify your work with tools like arc_summary or zfs-stats, which let you see your cache hit ratio and confirm your tuning is effective.

    The L2ARC: Your Massive Cache Extension

    This all works beautifully, of course, but it leads to an obvious architectural question. What happens when your “hot” working data set—the files and blocks your applications need constantly—is simply too large for the amount of RAM you can reasonably install in a server? Your cache hit rate plummets, and performance follows it off a cliff.

    This is the exact problem the Level Two ARC, or L2ARC, is designed to solve.

    Think of the L2ARC as a vast, secondary read cache. It doesn’t live in your precious system RAM; instead, it lives on a fast, dedicated storage device. My personal go-to for this is a high-quality SSD or, even better, an NVMe drive. This creates a new, intermediate tier in the performance hierarchy. It is, of course, slower than the main ARC in RAM, but it’s an order of magnitude faster than going all the way back to your main pool of spinning disks. It’s an elegant way to bridge that performance gap.

    The mechanics are quite direct. When a data block is being pushed out of the main ARC due to memory pressure, ZFS says, “Wait! Before you go, let me write a copy of you over here to the L2ARC device.” This is how the secondary cache gets populated.

    But there is a critical trade-off here, a “cost of admission” you have to pay. To find anything in that massive L2ARC, ZFS has to keep a table of contents, and that table lives in your primary ARC… back in your RAM. This metadata consumes a small but non-trivial amount of your fastest resource, a cost you must account for.

    My personal rule of thumb is this: only add an L2ARC if your ARC is already full and your ARC hit rate is lower than you’d like. Don’t add an L2ARC if you can just add more RAM!

    Finally, a very practical note on reboots. In older ZFS versions, the L2ARC was wiped clean every time the system restarted, which was incredibly inefficient. Thankfully, modern ZFS now supports a persistent L2ARC, so it survives a restart and is immediately effective. This is a massive operational improvement!

    The SLOG: Your Synchronous Write Accelerator

    So far, we’ve focused entirely on read performance. Let’s shift our attention to the other side of the coin: writes. Because not all writes are created equal, and understanding this difference is fundamental to good design.

    • Asynchronous Writes: Most of the time, an application writes data, and ZFS accepts it into the ARC (in RAM) and immediately tells the application, “Got it, job done!” This is incredibly fast because the application doesn’t have to wait for the data to hit the slow disks.
    • Synchronous Writes: But there are critical workloads where that’s just not safe enough. Think of a database committing a transaction, an NFS server acknowledging a write, or a block update over an iSCSI LUN. These applications require an absolute guarantee that their data has been committed to stable, persistent storage before they will proceed. This is a synchronous write. And this is where you can hit a serious performance bottleneck if you’re not careful.

    This is where the SLOG comes in. The mechanism ZFS uses for these high-integrity writes is called the ZFS Intent Log (ZIL). By default, the ZIL lives right alongside your data on your main storage pool. And if that pool is made of spinning rust, that’s your bottleneck. The application is stuck waiting for a slow, mechanical process.

    To fix this, we introduce a Separate Log Device, or SLOG. For these sync-heavy workloads, I add a small, very fast device—typically a high-quality NVMe drive—and dedicate it entirely to hosting the ZIL. Its only job is to receive those urgent synchronous writes at incredible speed, allowing ZFS to immediately send that “committed to stable storage” acknowledgement back to the application. The data is then lazily flushed to the main pool later on.

    For database servers, iSCSI targets, or NFS shares, adding a SLOG can be absolutely transformational. It is a targeted, surgical solution for a very specific, and very important, problem.

    Let’s be absolutely clear on one thing: a SLOG will only accelerate synchronous writes. If your workload is purely asynchronous (like a large file archive), adding a SLOG will have zero impact on performance. I’ve seen too many people waste money on this!

    When it comes to the device itself, here is my unbreakable rule: your SLOG device must have power-loss protection (PLP). This is non-negotiable. Enterprise-grade SSDs and NVMe drives have onboard supercapacitors that guarantee any write acknowledged is truly safe, even during a sudden power failure. A consumer drive without this feature can lie to ZFS, creating a terrifying window for data loss. It’s a risk you simply cannot afford to take. Because this device is so critical, I also always recommend mirroring your SLOG in production environments.

    Tying It All Together: An Office Analogy

    With all the pieces on the table, let’s trace the journey of a request in our perfectly tuned system. What I find helps is a simple office analogy:

    • The ARC is the paperwork on your desk. It’s in RAM, giving you immediate, lightning-fast access.
    • The L2ARC is the filing cabinet right behind you. It’s on a fast SSD. It takes a second to turn around and open the drawer, but it’s still very quick and holds way more than your desk.
    • The Main Storage Pool is the off-site archive. Everything is there, and it’s vast, but it takes a significant amount of time to retrieve something.
    • The SLOG? That’s the secure express courier waiting at the front door. It doesn’t store things long-term, but it provides a guaranteed, high-speed intake for your most urgent and critical documents (your synchronous writes).

    When an application requests data, ZFS checks your desk (ARC), then the filing cabinet (L2ARC), and only then sends a request to the off-site archive (Pool).

    When a critical document arrives, the courier (SLOG) signs for it instantly, providing guaranteed delivery, and then hands it off to you to place on your desk (ARC) before you eventually file it away in the archive (Pool).

    Conclusion

    So there you have it. Each of these components has a very distinct, well-defined role. The ARC is your primary cache for ultimate speed. The L2ARC is the massive secondary read cache for when your working set doesn’t fit in memory. And the SLOG is the specialized, high-speed intake built exclusively to handle the demands of synchronous writes.

    Mastering the interplay between these three is, in my experience, the difference between a good ZFS system and a truly great one. It’s how you architect for both blistering performance and deep, unwavering resilience.

    I really hope this deep dive has been helpful for you. Join me for the next episode where we’ll have a very special guest for an episode titled, Guest Interview: ZFS for the Enterprise with a Core Developer. It’s going to be a fascinating discussion you won’t want to miss.

    Until then, thank you for reading, and as always, feel free to leave any questions or comments below!

  • Episode 15: The Bedrock of ZFS Explained

    Episode 15: The Bedrock of ZFS Explained

    Hello and welcome back to the workshop! I’m so glad you’re here. Today, we’re rolling up our sleeves and getting our hands dirty with the absolute core of ZFS, its foundational architecture: vdevs, Pools, and RAID-Z.

    Now, one of the first hurdles I see people stumble over when they’re new to this world is thinking of ZFS as just another filesystem. That, my friends, is a fundamental misunderstanding that can lead to some painful mistakes down the road. After years of building and managing these systems, I’ve learned it’s far more accurate—and much more helpful—to think of ZFS as a combined volume manager and, critically, a tireless guardian of your data’s integrity.

    Getting these foundational building blocks right from the very beginning is completely non-negotiable. If you want to build a storage solution that is genuinely resilient, performant, and scalable, your success is determined by the decisions you make at this level. Think of this as pouring the concrete foundation for a skyscraper. Everything we’ll cover in future episodes—all the advanced features and performance tuning—rests on the principles we’re about to discuss. So, let’s get to it!

    The Bricks of the Build: What is a Vdev?

    Let’s start with the absolute smallest component in our system: the vdev, which stands for Virtual Device.

    I find the simplest way to explain it is to think of vdevs as the Lego blocks from which you construct your entire storage empire. They are the fundamental, indivisible units of your storage. Now, technically, a single disk can be a vdev, but for any system you actually care about, that’s a configuration I would never recommend. For our purposes, and for any resilient system, a vdev is a group of disks configured for redundancy.

    This could be a two-disk mirror or a set of six disks in what ZFS calls RAID-Z. The crucial takeaway here is this: the type of vdev you create dictates the fault tolerance and the performance characteristics for that entire group of disks. It’s the foundational decision, and it’s one you make for each and every block you add to your build.

    The Structure Itself: Combining Vdevs into a Pool

    Once you have your vdevs—your resilient Lego blocks—the next step is to combine them into the structure itself. This is the ZFS pool, or ‘zpool‘ as you’ll see it called in the command line. This is the top-level container; it’s the actual storage space you’ll carve up and use.

    A pool is created from one or more vdevs. And here we come to one of the most critical design rules in ZFS, something you absolutely must burn into your brain before you type a single command:

    Once a vdev is added to a pool, it is permanent. You cannot remove it.

    This isn’t a bug; it’s a core design feature tied to how ZFS achieves its incredible performance. ZFS stripes data across all the vdevs in the pool. The best analogy I’ve found is to think of a multi-lane highway. Each vdev you add is a brand new lane. When you add a second vdev to your pool, you’re not just adding capacity; you’re adding another lane to that highway, increasing the total data throughput of the entire system. All your data can now flow across all available lanes, which is what delivers that impressive aggregate performance. But you can’t just rip a lane out of the middle of a highway without causing a catastrophic failure, and the same is true here.

    The Mirror Vdev: Built for Speed

    Let’s examine our first, and simplest, redundant vdev: the mirror. In its most common form, this is a vdev made of two disks where data is written identically to both. Think of it as a perfect clone.

    The pros here are incredibly compelling:

    • Excellent Read Performance: ZFS can satisfy read requests from either disk in the mirror, effectively load-balancing and often doubling your read throughput compared to a single disk.
    • Fast Rebuilds: If a disk fails, the resilver—ZFS’s term for a rebuild—is extremely fast. It’s just a straight, block-for-block copy from the surviving disk to the new one.

    The con is obvious: storage efficiency. A two-way mirror provides only 50% of its raw capacity as usable space. That’s a trade-off, but in my experience, it’s one that is absolutely worth it for certain workloads. My personal gold standard is to use mirrors for boot drives, database storage, and virtual machine disks—any workload with heavy, random I/O where that blistering performance is paramount.

    RAID-Z: The Capacity Champion with an Unbeatable Defense

    While mirrors are fantastic for performance, when we need sheer capacity, we turn to RAID-Z. This is ZFS’s unique implementation of parity-based redundancy, an elegant evolution of the traditional RAID-5 and RAID-6 you may have used in the past.

    Its defining feature, and frankly the reason I trust it implicitly with my data, is its immunity to the infamous RAID write hole. Let me paint a vivid, and painfully common, picture: with a traditional hardware RAID card, if you lose power right in the middle of a write operation, you can end up with inconsistent parity. The data block gets written, but the parity block doesn’t (or vice versa). Your array thinks it’s healthy, but your data and its protection are out of sync. This is a ticking time bomb of silent data corruption.

    ZFS completely eliminates this risk through its copy-on-write nature. It never overwrites data in place. Instead, it writes new data and its corresponding parity to a completely new location on disk. Only when that entire transaction is confirmed as successful on the physical platters does it update the metadata to point to the new, correct blocks. If the power cuts out mid-way, the old, consistent data remains completely untouched. This transactional integrity is the bedrock of ZFS’s reliability.

    With that peace of mind, let’s look at the family:

    • RAID-Z1: Uses single parity, meaning the vdev can survive the failure of any one disk. It offers a good balance of capacity, but with today’s enormous multi-terabyte drives, I’ve grown very cautious about using it.
    • RAID-Z2: Uses double parity and can withstand the failure of any two disks. When a 16TB drive is resilvering for hours (or days!), the stress on the other drives is immense. Having that second layer of protection is, in my view, essential. This is my recommended professional standard for almost any new capacity-focused build.
    • RAID-Z3: Triple parity. It can survive three simultaneous disk failures. This is for massive arrays or truly mission-critical data where the cost of failure is astronomical.

    Your choice here is a direct trade-off between usable capacity and your operational peace of mind.

    Designing Your Vdevs: Practical Rules of the Road

    Let’s talk design, because there are a few nuances here that separate a good ZFS setup from a great one.

    First, unlike a mirror, the write performance of a single RAID-Z vdev is generally limited by the speed of a single disk. This is a consequence of the read-modify-write cycle and the parity calculations required for every write. It’s the trade-off you accept for that excellent storage efficiency.

    Second, and this is a key best practice I build into all my designs: for optimal space efficiency, configure your RAID-Z vdevs so the number of data disks is a power of two. For example:

    • A great RAID-Z1 vdev might have 5 disks (4 for data, 1 for parity).
    • An excellent RAID-Z2 vdev might have 6 disks (4 for data, 2 for parity) or 10 disks (8 for data, 2 for parity).

    This simple rule aligns with ZFS’s internal data structures and minimizes wasted space due to padding. It’s a small detail that pays dividends.

    And finally, my unbreakable rule: use identically sized disks within any single vdev. If you mix a 4TB drive with a bunch of 8TB drives, ZFS will treat all of them as 4TB drives. You’re just throwing money and capacity away. Consistency is everything.

    The Most Common ZFS ‘Gotcha’: How to Grow Your Pool

    This brings us to a critical, operational question that trips up so many people. How do you grow your pool? Many people assume they can simply add one new disk to an existing RAID-Z vdev to increase its size. I need to be crystal clear:

    You cannot expand a RAID-Z vdev by adding one disk at a time.

    That is not how ZFS works. The correct procedure, and the one you must design for from day one, is to expand your pool by adding another, complete vdev. For example, if your pool currently has one six-disk RAID-Z2 vdev, you expand your storage by adding a second, identical six-disk RAID-Z2 vdev. ZFS will then see both vdevs and intelligently stripe all new data across them, giving you a boost in both capacity and performance.

    This is why planning your server chassis layout and initial vdev size is so crucial. You aren’t just building for today; you are mapping out your expansion path for tomorrow.

    A Rogues’ Gallery of Common Mistakes

    Having seen many systems in the wild, I want to walk you through a few architectural mistakes that are painfully common but easy to avoid with a little foresight.

    1. The Single, Massive Vdev: It’s tempting to create one giant RAID-Z2 vdev with, say, 24 disks. On paper, it seems efficient. In practice, should a disk fail, you’re facing a terrifyingly long resilver time, putting immense stress on the remaining drives and leaving yourself with no flexible path for expansion.
    2. The ‘RAID-0’ Pool of Death: This is the most dangerous mistake, and something you should never, ever do. Creating a pool from multiple single-disk vdevs is just a stripe set. It has zero redundancy. The failure of any one of those disks guarantees the total and unrecoverable loss of the entire pool.
    3. Using RAID-Z1 with Large Drives: I’ll say it again because it’s that important. I always avoid using RAID-Z1 with today’s multi-terabyte drives. The resilver window is simply too long. The risk of a second disk failing during that high-I/O process is one I’m not willing to take, which is why I see RAID-Z2 as the only responsible baseline for modern, capacity-focused arrays.

    Tying It All Together

    So, let’s bring this home. The key takeaway, if you remember nothing else from today, is this: vdevs are your foundational, redundant building blocks. The pools you create are the usable storage space, and their performance is a direct result of striping data across those vdevs.

    I hope it’s clear now that the layout you choose on day one pre-determines everything that follows—your performance, your resilience, and, critically, your future expansion path. These aren’t small decisions, but by understanding these core principles, you are now equipped to make them wisely.

    We’ve built a solid, safe foundation for our data. But how do we make it fly? In our next episode, we’ll explore exactly that by diving into ZFS’s incredibly intelligent caching layers. If today was about building a rock-solid foundation, next time is about strapping a rocket to it.

    Join me for Episode 16: ‘The ZFS ARC, L2ARC, and SLOG Explained’—it’s where the real performance magic happens.

    Until then, thank you for listening! As always, I’d love to hear your thoughts or questions in the comments below.

  • Episode: 14: ZFS Basics: Why the Industry is Obsessed 

    Episode: 14: ZFS Basics: Why the Industry is Obsessed 

    Hello and welcome back to the Architecting Zero Downtime Infrastructure blog and podcast! It’s great to have you with me again. Today, we’re diving into a piece of technology that I believe is absolutely fundamental to building truly resilient systems. It’s called ZFS, and if you think of it as “just another filesystem,” you’re only seeing the tip of a very impressive iceberg.

    In reality, ZFS is a combined filesystem and logical volume manager—an entire storage platform. Its reputation for data integrity isn’t just good; it’s legendary. This is precisely why you find it as the cornerstone in so many mission-critical systems, from vast enterprise data centers to the most sophisticated home labs. When you absolutely, positively cannot afford to lose or corrupt data, ZFS is often where the conversation begins and ends.

    The Origins of a Legend

    To really get why ZFS is such a big deal, I think it helps to travel back in time a bit. It was originally developed at Sun Microsystems for their powerhouse operating system, Solaris. The name itself—ZFS—stands for Zettabyte File System, which tells you everything you need to know about the incredible scale they were aiming for right from the start.

    But the design goals were what truly set it apart. The engineers were laser-focused on solving three persistent, painful problems:

    1. Combating silent data corruption.
    2. Enabling massive, seemingly endless scalability.
    3. Drastically simplifying storage administration. (This last one has always been a personal favorite of mine!)

    While Sun Microsystems is now a part of computing history, ZFS is more alive than ever. It thrives today as the open-source project OpenZFS, bringing its robust, enterprise-grade capabilities to everyone on platforms like Linux and FreeBSD.

    The Magic of Copy-on-Write (COW)

    Alright, let’s get into the first principle that truly sets ZFS apart. It’s a concept called Copy-on-Write, or COW.

    Let me paint a vivid picture for you. Imagine you’re working on a critical document. Most traditional filesystems behave like hitting the ‘Save’ button—they overwrite the existing data on the disk with your new changes. But what happens if the power cord gets kicked out halfway through that save operation? You’re left with a jumbled, corrupted mess. It’s a risk I’ve never been comfortable with in the systems I build.

    ZFS takes a fundamentally different, and safer, approach. It behaves like hitting ‘Save As‘.

    It never touches the active, good data. Instead, it writes your new data to a completely different, free block on the disk. Only after that new block is fully written and confirmed as complete does ZFS update the metadata to swing the pointer from the old data to the new. This simple, elegant change means your data on disk is always in a consistent state. It is never half-written. This is the first layer of protection ZFS offers, and frankly, it helps me sleep a little better at night.

    The Guardian of Your Data: Checksums and Self-Healing

    Copy-on-Write is a fantastic first line of defense, but ZFS goes so much deeper. What I find truly elegant is how it deals with the slow, silent decay of data known as ‘bit rot’. You might have perfectly healthy disks, but over many years, individual bits can spontaneously flip, and most systems would be completely oblivious.

    ZFS actively wages war on this. For every single block of data it writes, it also calculates a unique checksum. But here’s the brilliant part: it doesn’t store that checksum with the data. That would be like asking a student to grade their own test! Instead, ZFS stores the checksum in the parent block’s pointer to that data. This creates a chain of integrity—a self-verifying hierarchy known as a Merkle tree—that goes all the way to the top of the filesystem.

    So, when you read that data back, ZFS doesn’t just blindly hand it over. It re-calculates the checksum on the fly and verifies that it matches the one stored in the pointer. It’s a guarantee that the data you are reading is the exact data you originally wrote. No guesswork involved.

    This, my friends, is where ZFS goes from being clever to being downright magical. When ZFS finds a checksum mismatch, most filesystems would just give up and report a read error. In the environments I build, that’s simply not an acceptable outcome. ZFS, however, is different. Provided you have redundancy (and in any serious deployment using a mirror or RAID-Z, you always should), it doesn’t just report the error. It sees the bad block, transparently fetches the correct data from its redundant copy, and serves that good data to your application. Your application never even knows there was a problem.

    And then, in the background, without any intervention, ZFS rewrites the corrupted block with the correct data, healing the filesystem in real-time. This isn’t a utility you have to schedule. It’s a continuous, automatic process. This self-healing capability is what truly separates ZFS from the rest of the pack.

    Your Ultimate Safety Net: Instantaneous Snapshots

    If Copy-on-Write is the foundation, then snapshots are the first superpower you get to wield. A ZFS snapshot is an instantaneous, read-only record of your filesystem at a specific point in time.

    Because of ZFS’s design, creating one takes less than a second, and initially, it consumes almost no extra space. This makes frequent, automated snapshots not just possible, but a core part of a smart strategy. A ransomware attack hits your file server? Don’t panic. Just roll back to the clean snapshot you took five minutes before the attack. About to perform a risky system update? My unbreakable rule is to always take a snapshot first. If the update goes sideways, the rollback is instant. It’s an incredibly powerful and effective safety net.

    And for those times you need a writable copy for development or testing, you can create a ‘clone’ from any snapshot. This gives you a safe sandbox environment to play in, without ever putting your live production data at risk.

    Simplicity is a Feature: The ZFS Storage Pool

    Let’s talk about one of my favorite aspects of ZFS: how it brings a wonderful sense of calm to storage administration. The core concept here is the storage pool, or ‘zpool‘.

    You can stop thinking about individual disks, partitions, and separate volume managers. You simply hand your physical drives over to ZFS, and it presents them back to you as one single, unified pool of storage. All that underlying complexity is abstracted away.

    From that giant pool, you carve out what you need. A standard filesystem is called a ‘dataset‘. A raw block device, maybe for a virtual machine disk, is called a ‘zvol‘. These are incredibly lightweight to create. The real power here is that each dataset can have its own distinct rules. You can set one dataset to use aggressive compression, another to have strong native encryption, and a third to enforce a strict storage quota. This level of granular control, all managed within a single, simple pool, makes day-to-day administration a genuine pleasure.

    The ‘Batteries Included’ Powerhouse

    This brings me to another area where ZFS delivers tremendous value right out of the box. Many of the features I’m about to mention typically require expensive, dedicated hardware appliances or complex software layers. With ZFS, they’re just built-in.

    • Compression: My personal rule of thumb is to always enable LZ4 compression on new datasets. It’s incredibly fast, the CPU overhead is negligible for most modern workloads, and the space savings can be substantial. It’s completely transparent; your applications never even know it’s happening.
    • Encryption: ZFS provides strong, native encryption on a per-dataset basis. This gives you granular control to protect sensitive data at rest, right where it lives, without any third-party tools.
    • Deduplication: Now, I need to put on my ‘cautious mentor’ hat for a moment. While deduplication can offer incredible space savings in very specific scenarios (like storing many similar VM images), its memory requirements are significant. For most general-purpose workloads I’ve managed, the performance trade-off simply isn’t worth it. Good compression is often the more practical and reliable choice.

    Where the Magic Happens: Common Use Cases

    When you combine all these powerful features, you start to see why ZFS is the foundation for so many critical systems. In the field, I see it excel in three key applications:

    1. Network Attached Storage (NAS): This is the classic use case, where that absolute data integrity is completely non-negotiable.
    2. Virtualization Platforms: Systems like Proxmox heavily leverage ZFS. The ability to snapshot an entire virtual machine before a risky change is operationally invaluable.
    3. Robust Backup Servers: This is where a feature called zfs send and zfs receive shines. It allows you to replicate entire datasets—snapshots and all—to another machine with perfect fidelity, making it a dream for disaster recovery.

    Tying It All Together

    As we bring this overview to a close, I hope the reasons behind ZFS’s enduring reputation have become crystal clear. For me, it all comes down to three pillars:

    • First, its absolute, non-negotiable approach to data integrity, delivered through Copy-on-Write, constant checksumming, and its incredible ability to self-heal.
    • Second, its powerful, integrated features, like instant snapshots and transparent compression, which bring tremendous operational agility and efficiency.
    • And finally, its simplified administration, which turns a complex task into a manageable one through the elegance of storage pools.

    When you put this all together, you realize ZFS is far more than just a filesystem. I’ve found over years of building systems that it’s better thought of as a comprehensive data protection strategy, built right into the very foundation of your storage.

    As always, thanks so much for joining me on this journey. I love digging into this stuff, and I hope you’re finding it valuable.

    In our next episode, number fifteen, we’re going to get our hands dirty and build on what we learned today. The episode is titled, ‘Deep Dive: Understanding ZFS vdevs, Pools, and RAID-Z’, where we’ll explore the essential building blocks you need to construct your own truly resilient ZFS storage array.

    I can’t wait to see you there. Until then, stay resilient! And please, drop your questions or comments below—I read every single one.

  • Episode 13: A Blueprint for Ditching VMware

    Episode 13: A Blueprint for Ditching VMware

    Hello and welcome back to Architecting Zero Downtime Infrastructure!

    Hello and welcome back! In our last few episodes, we’ve been talking a lot about the theories and principles behind building rock-solid infrastructure. Today, I am so excited because we’re moving from theory to practice with a detailed, real-world case study. We’re calling this one: ‘Migrating a Mid-Sized Enterprise to Proxmox’.

    I see this scenario play out all the time. A business hits a critical inflection point with its infrastructure. They’re staring at an eye-watering renewal quote from a proprietary vendor like VMware, and they start to feel a creeping loss of control. It’s a painfully common story. The technology works, of course, but the financial and strategic cost eventually becomes an anchor, weighing the business down.

    This is that crucial moment when looking for a better way isn’t just an interesting idea—it becomes an absolute necessity for growth. In this episode, we’re going to walk through that exact journey. We’ll explore how one company took back control by transitioning to a powerful, open-source Proxmox cluster. We’ll cover everything: the initial evaluation, the new architecture, the nitty-gritty migration plan, and the final, real-world business outcomes.

    This isn’t just a story; it’s a practical blueprint. Let’s dive in.

    The Problem: A Classic Case of ‘Good Enough’ Isn’t Anymore

    Let me paint a vivid picture of our client for this case study. To protect their privacy, we’ll keep them anonymous, but I guarantee their situation will sound familiar to many of you. They’re a solid mid-sized enterprise running a critical workload of about seventy-five virtual machines.

    Their environment was a classic setup from five or six years ago: a three-node VMware vSphere cluster tethered to a dedicated Fibre Channel SAN. On this hardware, they ran the usual mix of workloads—Windows Server for Active Directory and SQL, alongside a healthy number of Linux VMs for their web applications and backend databases.

    The problem wasn’t that it didn’t work. The problem was that it was becoming a major liability. Here’s what they were facing:

    • Crippling Costs: An annual bill for VMware support and licensing that made their eyes water.
    • Aging Hardware: The servers and the SAN were at the end of their life, forcing a major capital expenditure decision.
    • Performance Bottlenecks: Their users were complaining. The old spinning-disk SAN just couldn’t keep up with modern demands, creating frustrating slowdowns that were starting to impact the business directly.

    It was the perfect storm of financial pressure, technical debt, and performance degradation. The dam was about to break.

    Choosing Our Tools: The Decision Matrix

    With the problems clearly defined, we entered the evaluation phase. Simply renewing the VMware license was on the table, of course, but that just kicked the can down the road without solving any of the core issues.

    So, we did a serious evaluation of the major players. We looked at Microsoft’s Hyper-V and another strong open-source contender, XCP-ng. When I guide a client through this, my process is to build a clear decision matrix. We don’t rely on feelings; we rely on data. Our criteria were straightforward:

    1. Total Cost of Ownership (TCO) over three years.
    2. High-Availability Features that were genuinely resilient.
    3. Seamless Backup Integration for disaster recovery.
    4. Storage Flexibility to avoid getting locked in again.
    5. Availability of professional, enterprise-grade support — this is non-negotiable for a business.

    After a thorough comparison, Proxmox was the clear winner. Its integrated nature—combining KVM for virtual machines and LXC for lightweight containers in one package—is exceptionally powerful. But the real deciding factor was its native software-defined storage. The ability to use Ceph directly on the hypervisor nodes represents a fundamentally more modern, efficient, and far more cost-effective architecture.

    Finally, Proxmox’s subscription model provided that enterprise support guarantee, making it a sound business decision, not just a cool technical one.

    The Blueprint: Hyper-Converged and Redundant by Design

    With the platform chosen, we moved to the fun part: the design phase. This is where you get the chance to fundamentally improve an environment, not just replace it.

    Instead of a three-node cluster, we designed a new five-node cluster using modern, high-density servers. My personal rule of thumb for a workload this size is to have what we call N+2 redundancy. This means the business can lose two entire hosts to failure or for maintenance, and the system continues to operate without any service degradation. That’s real peace of mind.

    The most significant architectural change, however, was moving to a hyper-converged model. Think of it like this: instead of having separate computers (servers) and a separate, expensive central storage brain (the SAN), we give each server a piece of a bigger, collective brain. We completely eliminated the dedicated SAN.

    In its place, we built a Ceph storage cluster using the blazing-fast NVMe drives inside each of the five Proxmox nodes. This creates a single, incredibly fast, and self-healing pool of storage. To connect it all, we built a resilient network on a pair of redundant 10-gigabit switches, with bonded connections for both Ceph’s backend traffic and the primary VM networking. It’s a clean, elegant design with absolutely no single point of failure.

    The Move: Measure Twice, Cut Once

    With a solid design in place, the focus shifts to execution. And let me tell you, in a project of this scale, planning is everything. You never, ever start with the crown jewels.

    My process is to build a carefully phased migration plan. We begin with the least critical systems—development servers, staging environments, internal tools. This allows the team to learn the process, iron out any kinks, and build confidence in a low-risk environment.

    For every single virtual machine, we create a detailed runbook. This is a precise checklist covering:

    • Pre-migration checks (backups, snapshots).
    • The specific offline conversion method.
    • A rigorous post-migration testing protocol.
    • And crucially, a clear rollback procedure. If anything doesn’t look 100% right, you can revert instantly.

    This isn’t just a technical exercise; communication with business stakeholders is paramount. We scheduled tight migration windows, typically overnight or on a weekend, to ensure absolutely minimal disruption to operations.

    In the Trenches: The Mechanics of the Move

    Alright, let’s get into the mechanics. For the majority of these machines, the process was quite methodical. We’d start by exporting the VM from VMware as a standard OVA file. Then, on the Proxmox side, we used a command-line tool, qm importovf, to handle the conversion and create the new VM. It’s a clean, scriptable process, which is exactly what you want for consistency.

    Now, this is where experience comes in handy. Windows VMs, in particular, can be tricky. They won’t boot correctly on new hardware without the right drivers. My little trick here is to prepare them by injecting the VirtIO drivers for the disk controller and the network card before the final shutdown on VMware. This ensures that when Windows wakes up in its new Proxmox home, it can actually see its disk and talk to the network.

    For some of the more sensitive Linux applications, we found a little post-migration tuning was needed—perhaps adjusting the CPU type emulation in KVM to get that last ounce of performance. It’s all about that attention to detail.

    My Unbreakable Rule: Pull the Plug

    Once the systems are running on the new platform, the job isn’t done. This next step is where theory becomes reality, and it’s how you build true, unshakeable confidence in the new system.

    My unbreakable rule on a project like this is to perform a controlled failure test, with the client’s team right there in the room with me. During a planned maintenance window, we walk over to the server rack, and I have them physically pull the power cables from one of the live cluster nodes.

    It’s a powerful moment. You can see the initial anxiety on their faces. We then turn to the monitor and watch the Proxmox interface. The system immediately detects the failure. Within minutes, you see the high-availability manager automatically restarting those affected VMs on the other healthy nodes in the cluster. No human intervention needed. Just a clean, fast, automatic recovery.

    This isn’t just a feature on a datasheet; it’s a live, visceral demonstration of the system’s resilience. It proves the design works exactly as promised.

    Every Project Has One: The ‘Gotcha’ Moment

    Of course, no project of this scale is ever entirely frictionless. Every experienced engineer knows to expect at least one ‘gotcha’ moment. For us, it appeared a week after the final cutover.

    One of the company’s most critical legacy database applications began showing intermittent performance degradation. It wasn’t failing, it was just… slowing down unpredictably. When this happens, my process is methodical. We started by checking the physical layers.

    • Storage: We analyzed the Ceph cluster’s performance. The metrics were flawless—IOPS and latency were far better than the old SAN.
    • Network: Again, latency was low, throughput was high, no issues there.

    When the underlying infrastructure is proven to be solid, you have to look deeper at the guest configuration itself. After reviewing the specific VM settings, we found the culprit. By default, Proxmox uses a generic, highly compatible CPU type for its VMs. For 95% of workloads, this is perfect. But this particular older application was sensitive to specific CPU instruction sets that the generic emulation was masking.

    The fix, once identified, was beautifully simple. I changed that one VM’s CPU type to ‘host’, which allows the virtual machine to see and use the physical CPU’s features directly. The problem vanished instantly.

    It’s a perfect real-world lesson: granular control isn’t just a nice-to-have feature; it’s what allows you to solve the really hard problems.

    Six Months Later: The Real-World Impact

    So, let’s fast forward six months. This is the point where you look past the technical success and measure the real business outcome.

    The financial impact was immediate and staggering. We projected a 70% reduction in virtualization-related costs over the next three years. That’s a figure that gets any CFO’s attention.

    But what I find even more satisfying are the performance gains. The IT director told me a key database report, which used to take nearly an hour to run on the old SAN, was now completing in under twenty minutes. A three-fold improvement, directly attributable to the all-flash Ceph storage.

    And for the operations team, their daily life is simply better. They manage the entire stack from a single web interface, and the integration of Proxmox Backup Server has turned their backup and recovery process from a source of anxiety into a routine, reliable task.

    Key Takeaways from Our Journey

    Looking back at this project, the core lessons are crystal clear:

    1. Meticulous planning is what truly underpins a successful migration. The work you do before you move a single byte of data is what determines the outcome.
    2. This is a clear demonstration that open-source platforms like Proxmox are absolutely enterprise-ready. They are not just for labs or hobbyists anymore.
    3. The move to a hyper-converged architecture delivers profound benefits that go far beyond just cost savings—it delivers incredible performance and operational simplicity.

    Thank you for joining me for this deep dive! The foundation of the architecture we built here was software-defined storage using Ceph. But this highlights the flexibility you gain with these modern platforms. Another immensely powerful option in the Proxmox ecosystem is ZFS, whose approach to data integrity is a complete game-changer.

    That’s why I hope you’ll join us next time for Episode 14, as we explore ‘ZFS Basics: Why the Industry is Obsessed with It’. You won’t want to miss it.

    As always, I’d love to hear your thoughts or questions in the comments below! Talk to you next time.

  • Episode 12: The Hidden Costs of ‘Free’ Hypervisors

    Episode 12: The Hidden Costs of ‘Free’ Hypervisors

    Hello and welcome back to the blog! It’s great to have you here for another episode of Architecting Zero Downtime Infrastructure. Today, we’re diving headfirst into a topic that I see trip up even the most seasoned teams during architectural reviews: the powerful, alluring, and often deceptive nature of the word ‘free’.

    More specifically, we’re going to build a framework for calculating the Total Cost of Ownership (TCO) for popular open-source hypervisors like Proxmox or XCP-ng. That zero-dollar price tag is incredibly tempting, isn’t it? It feels like you’re getting a massive head start on your budget. But as we’ll explore today, that ‘free’ license is just the first page of a much longer story. Over the course of this post, we’re going to deconstruct what that actually means for your budget, your team’s time, and your overall risk profile, revealing the very real expenses that hide in the shadows.

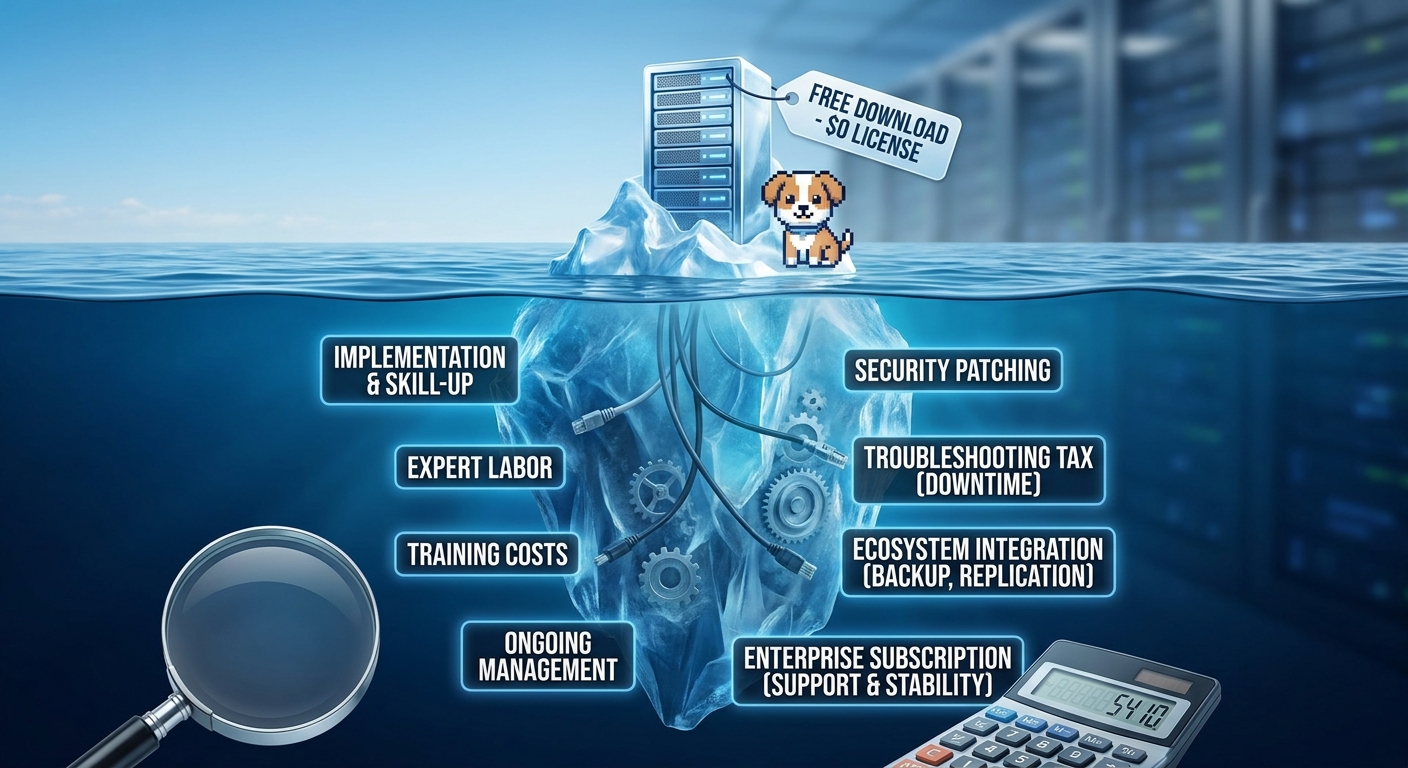
    The ‘Free Puppy’ Problem

    To really get our heads around this, we need to separate two very different ideas of ‘free’ that get thrown around in the open-source world. You’ll often hear the terms ‘gratis’ and ‘libre’.

    • Gratis means free of charge, as in, it costs no money.
    • Libre means freedom, as in liberty—the freedom to see the code, modify it, and control your own destiny.

    The illusion we’re tackling today lives almost entirely in that first word. Let me paint a vivid picture for you, one I come back to again and again: the free puppy analogy.

    Imagine someone offers you a puppy, completely free of charge. Wonderful! But is the puppy really free? Of course not. That’s just the beginning. The real cost—the true TCO—is in the food, the vet bills, the training classes, the chewed-up furniture, and the time commitment. Our infrastructure is no different.

    The hypervisor download is your free puppy. The hardware compatibility research, the expert labor required for a high-availability setup, the ongoing support model… those are the vet bills. And trust me, you will be paying them, one way or another.

    Cost Bucket #1: The Starting Line & The ‘Skill-Up’ Tax

    This is where your TCO meter officially starts running, often before you’ve even powered on a server. With a commercial solution like VMware, you typically start with a Hardware Compatibility List (HCL)—a clear, pre-vetted guide to what works. It’s a huge time-saver.

    With many open-source platforms, what I often see is the team spending dozens of hours just in research, trial, and error, simply to validate that their chosen servers, network cards, and storage controllers will play nicely. That’s a direct, and often unbudgeted, labor cost right out of the gate.

    Then you get to the architecture itself. Setting up a truly resilient, high-availability cluster isn’t just a few clicks in a wizard. You might find that properly configuring shared storage, networking, and cluster quorum requires a level of expertise that needs to be either developed internally or hired externally. This brings us to training—not just the course fees, but the opportunity cost of pulling your senior engineers off other valuable projects to skill up. All of this happens before you’ve migrated a single production workload.

    Cost Bucket #2: The Daily Grind & The ‘Troubleshooting Tax’

    Now, let’s talk about what is almost always your most significant ongoing expense: the human factor. Day-to-day management, applying security patches, performance tuning, health checks… these tasks are constant.

    With many open-source platforms, these processes can require more manual effort. You’re not just clicking an ‘update all’ button in a centralized manager; you’re potentially orchestrating a multi-step, command-line-driven process across your cluster that your team had to design, document, and learn themselves.

    But the real hidden cost emerges when something inevitably breaks. I call this the ‘troubleshooting tax’. This is the very real cost of your most senior (and expensive) engineer spending three hours on a Tuesday afternoon digging through forums and mailing list archives to solve a cryptic error on a storage controller. You’re paying for their time, but more critically, you’re paying with risk and potential downtime. This is where you have to honestly ask: how does that unpredictable cost compare to a commercial support contract with a guaranteed 30-minute response time?

    This also creates a business continuity risk I see all too often: the single in-house ‘guru’. This is the one person on the team who really knows how the whole thing works. When your platform’s stability rests on one individual, you’re carrying a significant, unquantified risk that becomes painfully obvious the day they go on vacation or, worse, leave the company.

    Cost Bucket #3: Mind the Gap – Assembling Your Ecosystem

    When you invest in a commercial platform, you’re often buying into a tightly integrated suite of tools. Advanced backup, disaster recovery replication, and sophisticated virtual networking are often engineered to work together as a single, coherent system.

    With the open-source approach, you’ll often find you need to assemble this ecosystem yourself. Proxmox, for instance, pairs wonderfully with a tool called Proxmox Backup Server. But it is a separate deployment. It’s another system to provision, secure, update, and master. The responsibility for integrating these critical components—and ensuring they continue to work reliably together after every single update—falls squarely on your team. This is that classic ‘some assembly required’ cost, adding both potential software fees and significant integration labor to your TCO.

    The Sanity Check: The Enterprise Subscription

    It’s easy to see the paid enterprise subscriptions offered by projects like Proxmox or for XCP-ng (via Xen Orchestra) as a failure of the ‘free’ model. My unbreakable rule is to view it differently: see it as a critical and non-negotiable component of your TCO calculation for any serious production environment.

    What are you actually buying? You’re not just getting a license key; you are purchasing stability and predictability.

    1. Validated Updates: You gain access to enterprise repositories where patches have been more rigorously tested for production environments. This isn’t the bleeding edge; it’s the stable edge.
    2. Professional Support: You’re buying a direct line to the experts who build the software. That ‘troubleshooting tax’ we just talked about? This is the insurance policy against it.

    My personal process is to put the annual subscription cost on one side of a ledger, and the fully-loaded cost of my senior engineers’ time spent self-supporting on the other. Very quickly, you’ll find that the subscription is a powerful risk mitigation strategy that buys you peace of mind.

    Let’s Make It Tangible: A Simple TCO Framework

    Okay, let’s build a simple framework to make this real. The way I like to calculate TCO is with a clear formula:

    TCO = (Initial Setup Labor) + (Annual Subscription) + (Annual Management Labor) + (Potential Cost of Downtime)

    Now, let’s apply this to a standard three-node cluster for a small business:

    Expense CategoryBreakdownEstimated Cost
    Initial SetupSenior engineer labor (approx. 40 hours @ $100/hr)$4,000
    Ongoing ManagementPatching, health checks, minor adjustments (60 hours/yr)$6,000
    Enterprise SubscriptionModest fee for stable updates and professional support$2,000
    Total First-Year Cost(Before factoring in financial impacts of unplanned downtime)$12,000

    Suddenly, your ‘free’ platform has a very real first-year cost of $12,000. When you run these numbers honestly, you might be shocked to find that the open-source TCO is much closer to, and can sometimes even exceed, the initial licensing cost of a commercial alternative.

    Beyond the Spreadsheet: The Strategic Equation

    A TCO spreadsheet is an essential tool, but the analysis can’t stop there. I always encourage teams to look at the intangible, strategic side of the equation.

    On the one hand, commercial products come with the very real strategic cost of vendor lock-in. Your architecture, your operational knowledge, and your automation scripts become deeply tied to one company’s roadmap and licensing model. This often comes with the quiet threat of a licensing audit, which no one enjoys.

    On the other hand, open-source provides strategic freedom. These systems are typically API-first by design, which allows for a level of deep customization and automation that is often impossible with proprietary platforms. You aren’t forced to upgrade on someone else’s schedule, and you don’t have to worry about a critical feature being deprecated. The platform is truly yours.

    Ultimately, this is a fundamental choice: the predictable stability of a commercial vendor versus the ultimate flexibility and control of an open platform. That’s a decision that goes far beyond the numbers on a spreadsheet.

    So, Where Does ‘Free’ Win?

    So, when does the open-source TCO model actually work in your favor? My personal rule of thumb is that the TCO is most favorable in these scenarios:

    • Where Expertise Already Exists: Think of a tech-forward small business with a deep bench of Linux talent. For them, the labor cost for management is naturally lower, making the entire model far more attractive.
    • At Massive Scale: For hyperscalers or large enterprises with thousands of hosts, the cost of per-socket commercial licensing becomes astronomical. At that point, funding an internal team of experts is the obvious financial decision.
    • Dev/Test Environments: These are a perfect place to leverage the freedom of open-source without the stringent uptime requirements and support needs of production.

    Your First Step, Not Your Last Word

    If there’s one thing I hope you take away today, it’s that ‘free’ is simply the starting point of the conversation, not the conclusion. Before you commit to any platform—open-source or commercial—your first step should be to build a comprehensive TCO model. Be brutally honest about the numbers: the cost of your team’s time, the price of subscriptions for stability, and the potential business cost of an outage.

    Making that calculation isn’t just a box-checking exercise; it’s the very foundation of a sound architectural decision.

    Now that we’ve established this framework, the next logical step is to see it in the wild. That’s exactly what we’ll be doing in our next episode, where we’ll walk through a real-world example.

    I hope you’ll join me for Episode 13: ‘Case Study: Migrating a Mid-Sized Enterprise to Proxmox’. We’ll get an on-the-ground view of the challenges, the unexpected costs, and the ultimate rewards of making that switch.

    Until then, thank you for reading! I’d love to hear your own stories about calculating TCO in the comments below. Have you ever been surprised by the hidden costs of ‘free’? Let’s talk about it.

  • Episode 11: Unlocking Proxmox’s Hidden Speed

    Episode 11: Unlocking Proxmox’s Hidden Speed

    Hello and welcome back to Architecting Zero Downtime Infrastructure! It’s fantastic to have you here for episode eleven. Today, we’re diving into a topic that I find is so often overlooked but holds the key to incredible gains: performance tuning Proxmox.

    Let’s be honest, you’ve invested in some solid hardware. But are you truly getting every ounce of performance out of it? A standard Proxmox installation is a marvel of stability right out of the box. It’s designed to be a reliable workhorse for the widest possible range of hardware. Think of it like a new car straight from the factory—it runs beautifully, but it’s tuned for universal appeal, not for the specific track you’re racing on. The real power, the raw speed, and unshakeable stability that you paid for are often waiting just beneath that surface of default settings.

    Our mission today is to move beyond those defaults and unlock that hidden potential. And this isn’t just for folks running massive enterprise clusters! These principles will enhance the speed and stability of any system, from a single-node homelab to a multi-rack deployment. After all, performance isn’t just about flashy benchmark numbers; it’s a cornerstone of reliability and a critical component of any serious zero-downtime philosophy.

    So, let’s roll up our sleeves and get started!

    The Heart of the System: CPU Tuning

    We’ll begin with the very heart of your system: the CPU. When you configure a virtual machine, one of the most impactful settings you can touch is the CPU Type. By default, it’s set to something very generic for compatibility.

    My unbreakable rule for any performance-sensitive workload is to change this setting from the default to host. It’s a simple, powerful change with a direct, tangible payoff. Setting the type to host essentially passes through your physical CPU’s exact feature set to the virtual machine. This allows your applications to leverage all the modern instruction sets they were designed for, like AVX. It’s like telling your VM, “Stop pretending to be a generic processor and use the real, high-performance engine we have right here!”

    For mission-critical systems, we can go even further with CPU pinning and NUMA awareness:

    • Pinning: This is where you assign a VM’s virtual cores to specific physical cores on your host. It prevents the hypervisor’s scheduler from bouncing the workload between different cores. Why does this matter? Every time a process moves, it can lose its cached data, forcing it to fetch from much slower main memory. Pinning ensures consistency and dramatically reduces latency. It’s a must for applications like databases or real-time processing.
    • NUMA (Non-Uniform Memory Access): If you’re running a server with multiple physical CPU sockets, respecting NUMA is not just a tweak; it’s fundamental. It ensures that a VM running on Processor A uses the memory directly attached to Processor A, avoiding the much slower interconnect path to Processor B’s memory. For demanding databases, getting this right can be the difference between a system that flies and one that mysteriously crawls under load.

    Don’t Let Your Memory Float Away

    Next up, let’s talk about memory. One feature you’ll see enabled by default is memory ballooning. The idea is clever: the host can “reclaim” unused memory from a guest VM to give to another that needs it, allowing you to run more VMs on the same hardware. This is perfectly fine for development machines or less critical services.

    However, for a production database, a critical application server, or anything where memory access latency matters, my strong recommendation is to turn ballooning off. Give the VM a fixed, guaranteed slice of RAM. This prevents the host from trying to negotiate memory back from the guest right when it’s under heavy load, which can introduce unpredictable latency spikes. You trade a little bit of density for a whole lot of predictable performance.

    For a more advanced boost, I often look at enabling HugePages. Let me paint a vivid picture. Normally, the operating system manages memory in tiny 4-kilobyte chunks, like a warehouse manager tracking millions of individual small boxes. It’s a lot of overhead! HugePages allows the system to manage memory in much larger blocks—often 2 megabytes or even 1 gigabyte. It’s like switching from small boxes to massive shipping containers. The CPU has far less administrative work to do tracking memory locations, freeing it up to focus on your application’s actual work. For any workload with a large memory footprint, this is a change you will absolutely feel.

    Taming the I/O Beast: Storage Optimization

    If there’s one place where performance bottlenecks love to hide, it’s in storage I/O. For the underlying storage on a single host, I find ZFS is a fantastic choice for its incredible data integrity features and solid performance, while LVM-Thin is great for its speed and simplicity. (Ceph, of course, is the go-to for clustered environments, but that’s a whole other episode!)

    But the real tuning often happens on the virtual disk itself. A critical choice you’ll make is the cache setting. You’ll see two main options: writethrough and writeback.

    • writethrough is the safe default. It confirms a write only after the data is physically on the disk.
    • writeback is where the speed is. It confirms a write as soon as it hits the host’s super-fast RAM cache. The risk? If your host loses power before that cache is flushed to disk, you lose that data.

    My personal rule of thumb is to use writeback, but only if you have your host on a reliable battery backup (UPS). It’s a calculated risk for a massive reward in write performance. And while you’re in those settings, enable the modern io_uring option for I/O threading. It’s a genuine leap forward for asynchronous I/O and can really let your modern SSDs stretch their legs.

    Building a Multi-Lane Highway for Your Network

    Networking is an area where one simple choice can have an absolutely massive impact. When you create a VM, Proxmox has to give it a virtual network card. The default is often a fully emulated card, like an Intel e1000. It’s a marvel of compatibility—it will work with almost any guest OS, old or new. But it is slow because the host has to pretend to be a physical piece of hardware.

    For any modern guest operating system (which is likely everything you’re running), you should be using VirtIO. This is a paravirtualized driver, meaning it was designed from the ground up for virtualization. The guest OS knows it’s in a VM and uses a highly efficient, direct communication path to the host. The performance difference isn’t just a few percentage points; it’s orders of magnitude faster. This should be your non-negotiable standard.

    But here’s the pro-level trick: for any VM with multiple vCPUs, you must enable the Multi-Queue option. Without it, all network processing for that entire VM is crammed through a single virtual CPU core. A busy web server or firewall can easily overwhelm that one core, creating a completely artificial bottleneck. Enabling multi-queue allows the network workload to be distributed across several vCPUs in parallel. You’re effectively turning a single-lane country road into a multi-lane superhighway for your network traffic, preventing jams and dramatically increasing your total throughput. This change is transformative.

    The Other Half of the Equation: Guest OS Tuning

    Tuning the host is only half the battle. The performance you actually experience depends just as much on what’s happening inside the guest operating system.

    1. Install the Guest Agent and Drivers: The very first thing I do on any new VM is to ensure the QEMU guest agent and the correct VirtIO drivers are installed and running. Without these, the host and guest can’t communicate efficiently. You simply won’t get the storage or network speeds we’ve worked so hard to enable.
    2. Use noatime: This is a subtle but powerful tweak. In your guest’s filesystem settings (/etc/fstab on Linux), add the noatime mount option. By default, the OS performs a write operation every single time a file is read just to update its last-accessed timestamp. On a busy server, this can eliminate thousands of completely unnecessary I/O operations per second.
    3. Check Partition Alignment: This is a small detail that can yield a very real improvement in disk throughput. Making sure your partitions are correctly aligned with the underlying storage blocks prevents the drive from having to do extra work on every read and write. Most modern installers handle this correctly, but it’s worth verifying.

    Going Deeper: Tuning the Proxmox Host Kernel

    For those who want to wring every last drop of performance from their hardware, we can go a layer deeper and tune the Proxmox host kernel itself.

    • CPU Governor: The default governor, ondemand, saves power by scaling the CPU’s frequency up and down. This is great for a desktop, but it can introduce tiny bits of latency as the CPU ramps up. For systems where consistent, predictable speed is critical, I set the governor to performance. This pins the CPUs at their maximum frequency, ready to go at a moment’s notice.
    • I/O Scheduler: With today’s lightning-fast NVMe SSDs, the traditional I/O schedulers can sometimes become a bottleneck themselves. What you’ll often find works best is to set the I/O scheduler to none or mq-deadline. This essentially gets out of the way and lets the high-performance drive’s own internal logic manage its I/O queue much more efficiently.

    KVM vs. LXC: The Performance Trade-Off

    No performance discussion is complete without touching on the choice between a full KVM virtual machine and a lightweight LXC container. The answer from a pure performance perspective is clear: containers are significantly faster.

    Let me break it down. A KVM machine is like building a complete, separate house. It has its own foundation, its own walls, its own roof (the OS kernel). This creates a strong security boundary, but all that structure comes with overhead. An LXC container, on the other hand, is like a well-insulated apartment in a larger building. It shares the building’s foundation and structure (the host’s kernel) but has its own secure living space.

    Because it shares the host kernel, a container’s performance is incredibly close to running on bare metal. For applications like web servers, databases, or microservices where I need maximum efficiency, containers are my go-to choice. But when iron-clad isolation is the top priority—for multi-tenant services or running untrusted code—the security boundary of a full VM is the only correct answer. It’s a classic trade-off: near-bare-metal speed versus hardened isolation.

    You Can’t Improve What You Don’t Measure

    All of these changes are powerful, but they mean very little if you can’t prove their impact. This is where my most important rule comes into play: adopt a scientific approach.

    Before you change a single setting, establish a baseline. For storage, my go-to tool is fio, which can simulate real-world I/O patterns. For networking, iperf3 is perfect for measuring raw throughput.

    My process is rigid, but it works:

    1. Run the benchmark and document the baseline numbers.
    2. Make one single change. Just one.
    3. Run the exact same benchmark again.
    4. Document the new result.

    This discipline is what separates professional tuning from just guessing. It turns your assumptions into validated, quantifiable gains and ensures you’re actually making things better, not worse.

    Bringing It All Together

    Wow, we’ve covered a lot of ground today! We’ve walked through the full stack, from the host’s CPU and memory, down into the nitty-gritty of storage and networking, and finally into the guest OS itself.

    What I truly hope you take away from this is that exceptional performance is never an accident. It’s the direct result of active, methodical tuning. It’s this deliberate process that transforms a standard setup into a truly high-performance, resilient system—one that you can count on when it matters most.

    I hope you can join me next time for Episode 12, where we’ll be tackling a fascinating topic: “The Hidden Costs of ‘Free’: Calculating TCO for Open-Source Hypervisors”. We’ll dig into whether “free” software is truly free once you account for support, expertise, and operational effort. It’s a critical calculation for any business.

    As always, thank you for your time and attention today. If you have any questions or your own favorite tuning tips, please share them in the comments below! I’d love to hear from you.

  • Episode 10: The Other Half of High Availability

    Episode 10: The Other Half of High Availability

    Hello and welcome back! It’s great to have you here for another episode of Architecting Zero Downtime.

    Today, we’re diving deep into a topic that is absolutely critical but, I find, is often misunderstood:

    Proxmox Storage Architecture

    Specifically, we’re going to talk about why setting up compute high availability (HA) is only winning half the battle.

    This is a big one, because getting it wrong doesn’t just reduce your resilience—it can create a false sense of security that’s arguably more dangerous than having no HA at all.

    Let me paint a vivid picture, one I’ve seen play out more times than I can count.

    A talented team builds a beautiful multi-node Proxmox cluster. They meticulously configure High Availability, run all the failover tests, and watch with satisfaction as a simulated node failure causes virtual machines to restart on another host in mere seconds.

    It’s magic.

    They feel secure.

    They feel resilient.

    They feel… done.

    The problem is that they’ve often just shifted their single point of failure—not eliminated it.

    By connecting this brilliant, redundant compute cluster to a single, non-redundant NAS or SAN, they’ve created an Achilles’ heel for their entire operation.

    If that one storage box fails, the whole cluster goes dark.

    This episode is about closing that gap.

    We’re going to explore why storage is the other, equally critical, half of the high availability equation.


    What Proxmox HA Actually Does (And What It Doesn’t)

    First, let’s get crystal clear on what standard Proxmox HA actually does.

    In a properly configured cluster, the system is like a vigilant flight controller, constantly monitoring the health of your virtual machines.

    If one of the physical host servers suddenly fails—perhaps a power supply dies or a motherboard fails—the HA Manager detects this immediately.

    It then automatically restarts those affected virtual machines on another healthy node in the cluster.

    I like the analogy of having a hot standby pilot for an airplane.

    If the primary pilot is incapacitated, the co-pilot seamlessly takes control.

    The plane doesn’t fall out of the sky.

    The journey continues.

    But here’s the crucial distinction.

    This process only protects the compute aspect of the VM.

    It moves the running brain—the CPU and RAM state—to new hardware.

    This is only possible if the new host can still access the VM’s virtual disk.

    The storage—the VM’s long-term memory—must already be available from the new location.

    This entire mechanism relies on mature, battle-tested technologies such as:

    • Corosync for cluster communication
    • Fencing to safely isolate failed nodes

    It’s a fantastic system.

    But it has one fundamental dependency:

    Accessible shared storage.


    The Classic Trap: The Single Box of Failure

    This brings us to the design pattern responsible for many completely avoidable outages.

    The classic mistake.

    A team builds a beautiful Proxmox cluster…

    …and then connects every node via NFS or iSCSI to a single standalone NAS or SAN.

    At first glance this seems perfectly logical.

    Centralised storage is easy to manage.

    Unfortunately, this is where everything breaks.

    If that single storage appliance fails:

    • Controller failure
    • Power supply failure
    • Firmware issue
    • Hardware fault

    Every virtual disk immediately becomes unavailable to every node.

    Proxmox HA becomes completely powerless.

    It knows the VMs need restarting.

    But their disks no longer exist.

    It has the brain.

    The body has disappeared.

    What was supposed to be a high availability event becomes a complete cluster-wide outage—all because of one overlooked storage dependency.


    The Local Storage Dead End

    You might now be thinking:

    “I’ll just use local storage on each Proxmox node.”

    And you’re right.

    For pure I/O performance, local storage such as:

    • LVM
    • ZFS

    can be fantastic.

    Unfortunately, it creates another fatal problem for High Availability.

    I often describe this as putting your data in jail.

    If a motherboard dies…

    If a CPU fails…

    The VM disk is physically trapped inside that failed server.

    The remaining cluster cannot access it.

    Proxmox HA is willing to restart the workload.

    But the disk itself cannot move.

    At this point you’ve transitioned from:

    High Availability

    to

    Disaster Recovery.

    Your only option becomes restoring from backups.

    Which completely defeats the purpose of designing a zero-downtime platform.


    The Two Paths to True Storage Resilience

    So where do we go from here?

    The answer is to stop thinking of High Availability as a feature…

    …and instead design resilience into the architecture itself.

    There are two primary approaches.

    1. Resilient Shared Storage

    Storage remains centralised…

    …but the storage platform itself becomes highly available.

    The storage is no longer a single point of failure.

    2. Distributed Storage

    This is the Hyper-Converged Infrastructure (HCI) approach.

    Using software such as Ceph, the local disks inside every Proxmox node become one large distributed storage system.

    Storage is no longer centralised.

    Instead, it becomes self-healing and distributed across the cluster.

    These are the two architectural roads available.

    Either:

    • Build an incredibly resilient storage platform.

    or

    • Remove the central storage platform entirely.

    Path One: Fortifying the Citadel with Resilient Shared Storage

    Instead of thinking about a storage appliance…

    Think about a storage system.

    Enterprise storage platforms eliminate every single point of failure.

    Key design features include:

    Dual Controllers

    If one controller fails or is upgraded…

    The second immediately takes over.

    Redundant Power Supplies

    Each controller has independent power.

    Ideally supplied by separate PDUs and electrical circuits.

    Redundant Connectivity

    For iSCSI:

    Always implement Multipath I/O (MPIO).

    For NFS:

    Use LACP link aggregation across multiple switches.

    This ensures that one failed cable or switch never disconnects storage.

    The good news is that this level of resilience is no longer limited to expensive enterprise hardware.

    Solutions such as TrueNAS High Availability can provide enterprise-grade resilience on commodity servers.

    The principle remains the same.

    Your storage appliance is no longer one box.

    It’s effectively its own highly available cluster.


    Path Two: The Elegance of Distributed Storage with Ceph

    Personally, this is the architecture I find most elegant within a Proxmox environment.

    Rather than building a separate storage cluster…

    Ceph integrates storage directly into the compute cluster.

    It pools the local disks from every node into one distributed storage fabric.

    One that is:

    • Intelligent
    • Distributed
    • Self-healing

    When data is written to Ceph…

    It doesn’t create one copy.

    It typically creates three replicas.

    Each replica is stored on different disks in different physical hosts.

    If an entire server fails…

    Ceph doesn’t panic.

    It simply recognises that replicas have disappeared…

    …and automatically rebuilds them elsewhere.

    The storage heals itself.

    This is what enables:

    • Live Migration
    • True High Availability
    • Continuous storage availability

    for every node.


    Choosing the Right Architecture

    So which approach should you choose?

    It depends on your:

    • Budget
    • Operational model
    • Team expertise

    My general rule of thumb is:

    Dedicated HA SAN

    Advantages

    • Clear separation between compute and storage
    • Familiar enterprise operational model
    • Storage specialists manage storage

    Disadvantages

    • Higher capital cost
    • Potential vendor lock-in

    Ceph Hyper-Converged Infrastructure

    Advantages

    • Excellent scalability
    • Lower hardware costs
    • Compute and storage scale together
    • No dedicated storage hardware

    Disadvantages

    • More operational complexity
    • Requires an excellent network
    • Overall cluster health directly affects storage performance

    There isn’t one universally correct answer.

    Only the architecture that best fits your organisation.


    My Non-Negotiable Rule: The Network

    Regardless of which storage architecture you choose…

    Everything depends on the network.

    This is my one non-negotiable rule.

    A serious Proxmox deployment should always include:

    • Dedicated storage network
    • Redundant switching
    • Minimum 10 Gigabit Ethernet
    • Complete separation from management and VM traffic

    Building high availability on an underpowered storage network is like constructing a skyscraper on sand.

    Eventually…

    It will fail.


    Trust, But Verify

    Building the solution is only half the job.

    The other half is proving that it works.

    The only way to truly trust a High Availability platform is through deliberate failure testing.

    Pull power cables.

    Disconnect storage links.

    Simulate failed switches.

    Watch what happens.

    Verify that the environment behaves exactly as designed.

    Because an untested HA platform isn’t really High Availability.

    It’s simply a theory.


    Final Thoughts

    The key lesson from today’s discussion is simple.

    Proxmox High Availability provides compute resilience.

    It does not provide complete infrastructure resilience.

    True zero downtime only exists when storage is designed with the same level of resilience as the compute layer itself.

    Whether that means:

    • A dedicated HA SAN
    • Hyper-Converged Ceph

    the principle never changes.

    Your storage must be every bit as resilient as the workloads it supports.


    Next Episode

    In Episode 11 we’ll move from resilience to speed.

    Join me for:

    Performance Tuning Proxmox: Getting the Most from Your Hardware

    We’ll explore how to unlock the full performance potential of your cluster—not just keep it online.

    Until then…

    Happy architecting!

    And, as always, I’d love to hear your questions and experiences in the comments below.