
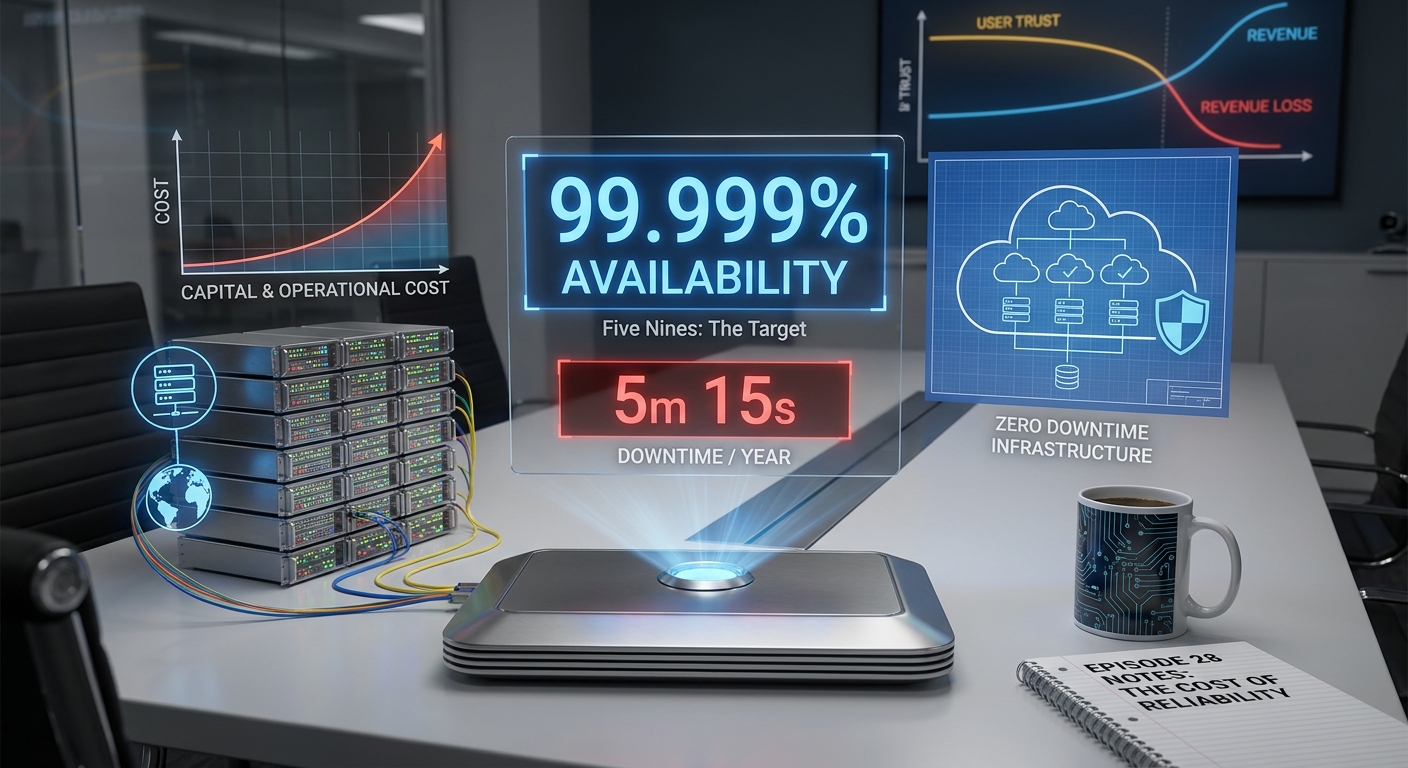
Hello and welcome back to Architecting Zero Downtime Infrastructure! It’s great to have you with us again.
Today, we’re going to tackle a term you’ve almost certainly heard thrown around in meetings, sales pitches, and technical documentation: ‘Five Nines’. In my experience, it’s often treated as this magical marketing buzzword, a shiny badge of honor that promises near-perfect reliability. But I want to pull back the curtain and explore how it’s actually a foundational concept in reliability engineering.
Why does this matter? Because getting this wrong—misunderstanding what it means and what it costs—has very real, and often very expensive, consequences for your business, your budget, and your reputation. It all comes down to a single number: 99.999%. It sounds incredibly close to perfection, doesn’t it? But it still allows for failure.
So, before we go any further, take a moment and guess. Over the course of an entire year, how much actual downtime does that 99.999% percentage permit? An hour? Thirty minutes? Five minutes? The answer is the key to understanding everything that follows. Let’s dive in.
The Brutal Math of Availability
Let’s put some hard numbers to these percentages, because this is where the abstract idea of ‘nines’ becomes painfully concrete. When I’m evaluating a system, I often start with a baseline that sounds pretty reasonable on paper.
- 99% Uptime (‘Two Nines’): This allows for 3.65 days of downtime per year. That’s over 87 hours! For most online businesses, being offline for more than three and a half days is simply catastrophic. Not acceptable.
- 99.9% Uptime (‘Three Nines’): Here, we’re down to 8.77 hours of downtime a year. That’s a huge improvement, but it’s still more than a full business day. Can your operations—or your customer trust—survive being offline for an entire day?
- 99.99% Uptime (‘Four Nines’): Now we’re making a serious leap. This brings us down to just 52.6 minutes of downtime for the entire year. Suddenly, we’re in the realm of high-availability.
- 99.999% Uptime (‘Five Nines’): And here it is, the coveted goal. This brings you down to a mere 5.26 minutes of downtime per year. Just over five minutes where things can be broken.
What you absolutely must understand is that the journey from one ‘nine’ to the next is not a gentle stroll. It’s an exponential climb up a very steep, very expensive mountain. The engineering effort, architectural complexity, and operational cost required to get from three nines to four is dramatically higher than going from two to three. And getting to that fifth nine? That’s a whole different level of commitment.
The Biggest Problem Isn’t the Math… It’s the Definition
On the surface, the formula for calculating uptime seems simple: (Total Time Available) / (Total Time Measured). But I’ve found that the biggest flaw in that formula isn’t the math; it’s the definition of a single, crucial word: downtime.
What does ‘down’ actually mean to your business? Let me paint a vivid picture.
Imagine a critical API call that normally responds in 50 milliseconds suddenly starts taking five full seconds. Is the service down? Technically, it’s still responding—it hasn’t thrown an error. But for the user waiting for the page to load, it might as well be. Or what if your website is up and running, serving pages beautifully, but the third-party payment gateway is failing every transaction? Your servers are humming along, but from the user’s perspective, your service is completely broken. They can’t accomplish what they came to do.
This is why I find that simply talking about ‘uptime’ isn’t precise enough for serious reliability work. You need to get more specific. This is where we introduce two powerful concepts:
- Service Level Indicators (SLIs): These are the specific, quantitative metrics you track. Think latency, error rate, throughput, or system saturation.
- Service Level Objectives (SLOs): These are the precise targets you set for your SLIs. For example, ‘99.9% of homepage requests will be served in under 200ms.’
Moving to an SLI/SLO model takes us from a vague, fuzzy idea of ‘uptime’ to a concrete, measurable, and actionable definition of performance. It shifts the entire conversation.
Down is Down: The User’s Perspective Matters Most
This brings us to another debate I see all the time: planned vs. unplanned downtime. Unplanned downtime is an outage—something has failed. Planned downtime is a scheduled maintenance window for an upgrade or a patch.
Now, here’s a little detail that often causes arguments: many Service Level Agreements (SLAs) will explicitly exclude planned downtime from their availability calculations. This is a neat trick that keeps the numbers looking great on a report. But here’s my unbreakable rule: from your user’s perspective, down is down.
Your users don’t care why your service is unavailable. They don’t differentiate between a database failure and a planned deployment. All they know is that they tried to use your service, and it failed them. This is why I think it’s far more valuable to measure what we call user-perceived availability. The real question isn’t, ‘Are our servers responding to pings?’ The question is, ‘Can the user accomplish their goal?’ If the answer is no, for any reason, you are effectively down in their eyes.
Let’s Talk Money: The Alarming Cost of an Outage
Once we’ve defined what ‘down’ means, the next step in my process is always to attach a dollar value to it. This is where the conversation moves from a purely technical exercise to a critical business discussion. Let’s make this real.
Imagine a successful e-commerce site that generates $1 million an hour in revenue. If you have an outage that lasts just fifteen minutes, you’ve just lost $250,000 in direct revenue. Vanished. That stark calculation focuses the mind immediately.
But that’s only the most obvious cost. The direct costs are often just the tip of the iceberg.
- Contractual Penalties: If you have enterprise customers, your SLAs likely have clauses that trigger penalty payouts if you breach your availability promise. Those can add up frighteningly quickly.
- Operational Cost: When an incident occurs, you pull your most senior, most expensive engineers into a ‘war room’ to fix it. Every minute they spend firefighting is a minute they aren’t spending building new features. This is a direct, and very high, operational cost that often gets overlooked.
- Reputational Damage: The real, lasting damage, however, is much harder to measure. Every minute of downtime erodes the single most valuable asset you have: customer trust. In today’s hyper-connected world, that broken promise spills onto social media and can become a negative headline in minutes. The harm to your brand can far outlast the outage itself.
- Opportunity Cost: This, in my view, is the most insidious cost of all. Every time your best engineers are pulled into firefighting, they are not innovating. They are not building the future of your business. They are simply trying to hold the present together. This is a long-term strategic loss that many companies fail to account for.
So, Is Five Nines Always the Goal?
If downtime is this expensive, you might be asking, ‘Why not just build everything for five nines and be done with it?’ The simple reason is that this level of availability is anything but free. The cost curve is exponential.
Architecturally, moving from three nines to four might require shifting from a simple redundant server setup (N+1) in one data center to a fully active-active, multi-region deployment. That’s a monumental leap in complexity, requiring sophisticated global load balancing, data replication strategies, and distributed systems expertise.
Operationally, the demands become immense. You need advanced, predictive monitoring and automated failover systems that can react faster than a human ever could. It means having a rigorous, well-drilled on-call process and a culture dedicated to reliability.
This leads to a fundamental question, and the answer is a clear and resounding no. The ‘right’ number of nines is not a technical absolute; it’s a business decision based on a cost-benefit analysis.
Your customer-facing payment gateway that processes transactions 24/7? Every second of downtime is lost revenue and lost trust. Investing in four or even five nines for that system makes perfect commercial sense. But what about an internal analytics service that runs a batch job overnight to generate a daily report? If that service is down for an hour, the report is delayed. It’s an inconvenience, sure, but it doesn’t stop the business. For that service, a target of three nines might be perfectly sufficient and vastly more cost-effective.
The goal isn’t to hit five nines everywhere. The goal is to align your investment in availability with the value of the service.
Beyond Uptime: A Richer View of Health
Finally, it’s critical to broaden our perspective beyond a simple up-or-down metric. I’ve seen services with 100% uptime that were still completely unusable. If your application takes thirty seconds to respond to every click, is it really ‘up’? From the user’s perspective, it’s broken.
This is why I encourage teams to monitor a richer set of metrics. A fantastic framework for this comes from Google’s Site Reliability Engineering (SRE) practice, known as the ‘Four Golden Signals’:
- Latency: How slow is the service for your users?
- Traffic: How much demand is being placed on your service?
- Errors: How often are requests failing?
- Saturation: How ‘full’ is your service? (i.e., how close are you to a capacity limit?)
By watching these four signals together, you get a much more complete, high-definition picture of service health. Because a service that is slow, or returning errors, is effectively down—no matter what your uptime dashboard says.
Tying It All Together
So, what I hope you take away from our discussion today are three main ideas. First, ‘the nines’ are simply a language we use to measure our tolerance for failure. Second, defining what ‘down’ actually means for your specific service is the most critical part of the entire exercise. And finally, choosing the right availability target is a strategic business decision, a balance between the cost of reliability and the cost of an outage.
Thank you for joining me on this deep dive. Now that we understand the theory and impact, what happens when it all goes wrong?
Join us next time for Episode 29, ‘Anatomy of an Outage: Post-Mortem on a Failed SAN’, where we’ll perform a deep-dive into a real-world failure to see what we can learn.
Until then, what are your thoughts on ‘the nines’? Have you fought these battles in your own organization? Drop a comment below—I’d love to hear from you!
Leave a Reply